
Technical analysis forms a key cornerstone of investment philosophy. It involves the filtering of different types of market data, such as price history or trading volumes, and using the conclusions of that research to establish when there might be good times to buy, sell, or hold positions. The approach can be used by an investor in any market that generates enough data to satisfy the criteria of the modelling techniques, one example of such a market being the widely traded big-name stocks found on the ASX index.
With there being very few instances where having extra information is a bad idea, learning how to do technical analysis can help you improve your trading and optimise your returns. The good news is that thanks to the approach being so popular, good brokers provide their clients with powerful technical analysis software tools that process the sometimes complicated formulae for them. Therefore, it is easy to access and apply a range of user-friendly on-screen trading signals specifically designed to boost your returns.
What is Technical Analysis?
Technical analysis is driven by one type of input: market data. In its simplest form, it involves viewing a price chart to determine if a price trend is likely to continue or reverse. That charting technique involves comparing the variables of price and time. Other elements of technical analysis incorporate different types of market data, such as trade volumes, long-term price averages, and price volatility levels.
The selected data is then processed through mathematical and statistical formulae to generate a reading as a single number – a technical indicator. That number will change over time as the incoming data from the market feeds into the mathematical model. As it changes, it will offer an insight into changes in market conditions and highlight possible trading opportunities.
Top Australian Brokers
- Pepperstone - Trading education - Read our review
- IC Markets - Experienced and highly regulated - Read our review
- eToro - Social and copy trading platform - Read our review
An extensive number of data input variables are available to technical analysts, and an almost infinite range of formulae that can be used to process the data set. That results in hundreds of technical indicators being available to use, but some of the most popular are the simplest.
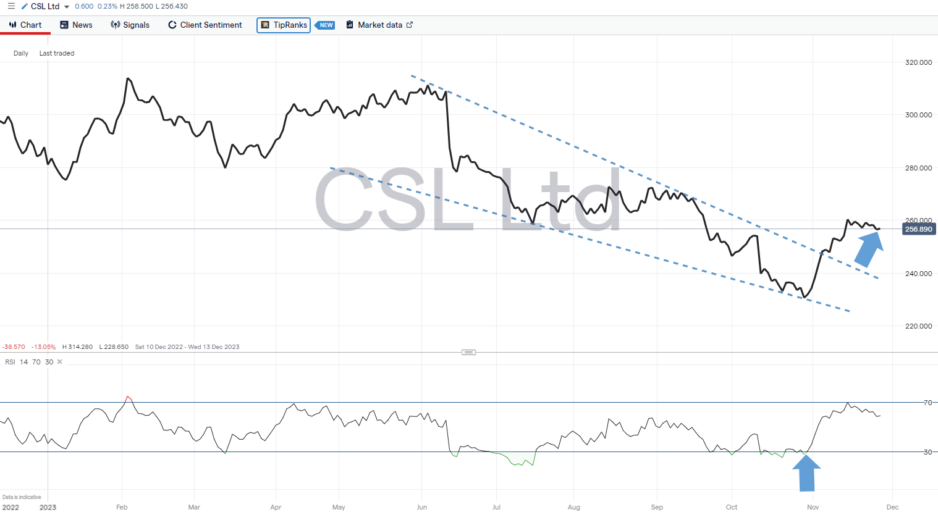
The price chart of CSL Ltd below shows the kind of input offered by technical analysis. The trendline break suggests momentum could be building because price has moved out of a long-term downward price channel. The RSI (Relative Strength Indicator), at the same time, gives a reading of below 30, suggesting that the market is ‘oversold’ on a daily timeframe. Using several technical indicators in conjunction can help establish how ‘strong’ a signal is, and the more signals that confirm a trading opportunity has arisen, the greater confidence a trader can have in their decision-making.
Technical vs Fundamental Analysis
Fundamental analysis involves using ‘real world’ information to guide trading decisions. It’s prevalent among investors in ASX stocks because events such as news announcements, trading performance reports, changes in management personnel, and the release of new product lines can all impact a firm’s potential profitability. With many classic stock valuation models being based on future company earnings, tracking fundamental changes to a firm’s business model can help investors establish which stocks to buy and sell now.
Whilst the new projects announced by a firm might not become a reality, it does highlight how fundamental analysis can be much more forward-looking compared to technical analysis, which is based solely on historical data and, therefore, is often seen as a ‘lagging’ indicator. The analogy that using technical analysis to trade is like driving forward while looking in the rear-view mirror would appear to weaken the reasons to use it. However, technical analysis has many proponents who use it as the sole guide to stock trading decisions, and others use it in conjunction with other schools of thought, such as fundamental or quantitative analysis. The half-way approach followed by some stock investors is to use fundamental analysis to establish if a stock is a buy or a sell, and technical analysis to identify the optimal time to execute a trade.
How to Read Stock Charts
The most valuable data point for fans of technical analysis is price history. Price charts show how the demand and supply of a stock have changed over time, and chartists use previous moves to extrapolate future ones. If successful, it taps into one of the secrets of successful investing – spotting trends and trading in the same direction.
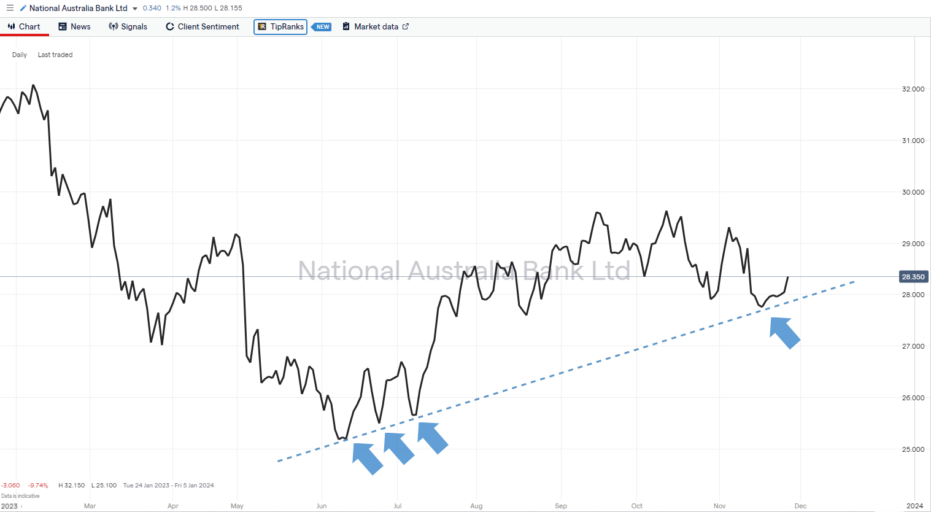
A trader who identified the three bounces in price in National Australia Bank stock in the below price chart could have identified a supporting trendline pattern pointing to further upward price moves. Following that strategy would involve holding the position whilst price remains above the trendline. If, or more accurately, when, price breaks the trendline, that is confirmation that the trend has ended and that profits ought to be banked. Those looking to add to positions or enter the trade at a later date would have done well to use technical analysis to help them patiently wait for price to drop to touch the trendline again before booking a buy trade.
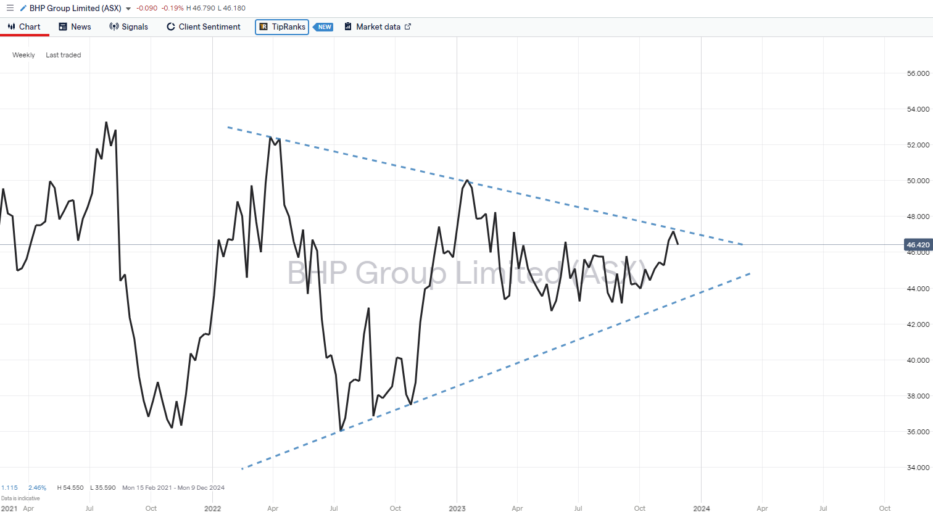
Stock charts can also identify moments when new trends are forming. The price chart for BHP shown below reflects how uncertainty regarding the company’s prospects has resulted in a period of sideways trading. The supporting and resistance trendlines have formed a sideways wedge pattern as price drifts towards the funnel of the pendant pattern. When price eventually breaks out of that pattern to the upside or downside, technical analysts would consider that a confirmation of the direction of the next trend.
What is Price Action Trading?
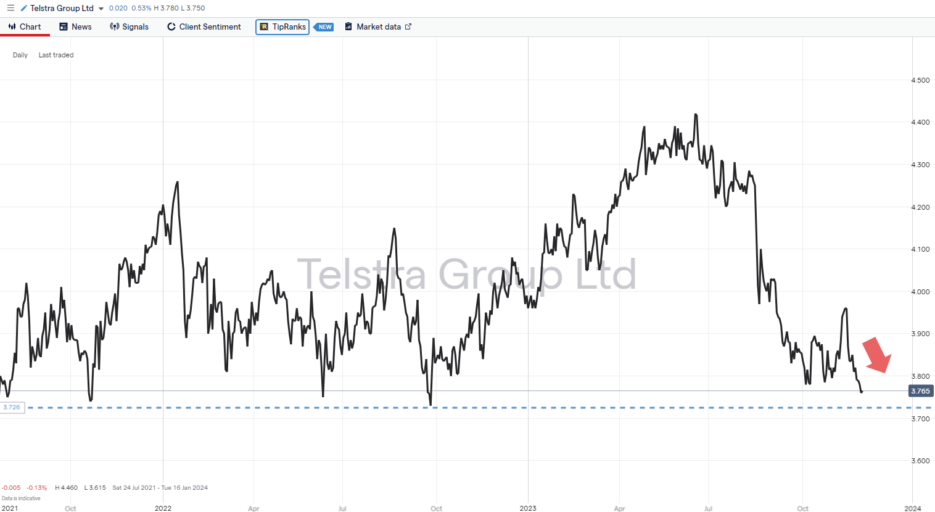
Price action is simply the term used to explain how a line detailing price levels moves over a chart over time. Some traders rely exclusively on price action to guide their decision-making, with their analysis helped by features such as support and resistance price levels. These could be upward or downward trendlines, as in the price charts above. They also include important high or low-price levels, which factor in the psychological importance of price moving into unchartered territory. In the below price chart, Telstra Group Ltd stock is nearing a support level that has previously been a point at which price rebounds. That offers opportunities for those looking to buy the dip, but a break below the line would trigger an opposite signal, indicating that the path of least resistance is now downward.
Technical Analysis Trading
Those looking to learn how to do technical analysis will benefit from appreciating how indicators are broken down into a series of subgroups. The filtering is determined by how they are created and their intended purpose. There are some grey areas, with some indicators, for example, having a claim to be included in two separate groups. However, understanding the basic breakdown is the first step in a program designed to explain technical analysis for beginners.
Trend Indicators
These measure the strength and direction of a trend by comparing current price to a long-term baseline measure, such as a simple moving average. If price is moving upward, away from the long-term baseline measure, then an upward trend could be forming. The greater the pace of divergence, the stronger the trend. Technical indicators used as part of trend analysis include MACD (Moving Average Convergence Divergence), Parabolic SAR (Parabolic Stop and Reverse), and Moving Averages.
Momentum Indicators
Comparing the size of current price moves to historical ones can establish if a market is experiencing increased momentum. Put simply, something is going on in that market that might be worth trading. Widely used momentum indicators include the Stochastic Oscillator, CCI (Commodity Channel Index), and Relative Strength Index (RSI).
Volatility Indicators
Volatility indicators measure the rate of a price move, regardless of its direction. One key data point in this form of analysis is previously low and high prices, with the indicator being useful to spot instances when a price move in an ASK stock might change direction. Two popular volatility indicators are Bollinger Bands and Average True Range.
Volume Indicators
The last of the four main categories of technical analysis tools are volume indicators. The Chaikin Oscillator and OBV (On Balance Volume) indicators introduce the idea that price moves are more likely to be confirmed if they happen during periods when trade volumes are increased. More buyers and sellers are actively trading a stock, so the ultimate ‘winners’ of that exchange have a greater degree of conviction about the direction of the next price move.
Final Thoughts
Some traders base their decision-making entirely on technical analysis. Others incorporate it into strategies that also draw on other forms of analysis. Part of the reason for the popularity is that with so many traders watching the same price chart and using similar indicators, the support and resistance levels can become self-fulfilling prophecies. If groups of traders book trades at similar times based on the same signal, that alone can trigger the expected price move.