
Fundamental analysis is the cornerstone of many investment strategies. It involves studying core factors that influence the price of an asset, such as an ASX200 stock, and considering potential future events that might impact your strategy. Fundamental analysis of stocks allows you to establish if a stock is overvalued or undervalued, which leads to knowing the times to buy and sell. This raises the question, what is fundamental analysis, and what is the best way to use it?

What is Fundamental Analysis?
Fundamental analysis involves studying the ‘real-world’ factors that determine the current health of a business and its prospects. That allows analysts to establish an opinion on a company’s intrinsic value and whether its current stock price is trading at fair market value. Moments when a stock such as Westpac Banking Corp is not trading at fair value would trigger a decision to buy or sell the shares.
The approach involves considering elements specific to the company, for example, the quality and capability of the management team and external macroeconomic factors such as global investor risk appetite and long-term business cycles.
Fundamental analysis can also be forward-looking and factor in new developments, which could act as a catalyst for a change in a company’s stock price. It could be the case that after carrying out an analysis of a company’s new product launch, you expect the firm to increase market share or improve profit margins when that product is released to consumers. That might trigger a decision to buy the stock in anticipation of there being greater interest in the stock shown by other investors as the scenario plays out. Alternatively, you may take a negative view of the geopolitical climate and think shock events could cause uncertainty in the economic system, which would deflate the prices of most stocks.
Top Australian Brokers
- Pepperstone - Trading education - Read our review
- IC Markets - Experienced and highly regulated - Read our review
- eToro - Social and copy trading platform - Read our review
There are other schools of thought in the investment community, including quantitative, sentiment, and technical analysis. Quantitative analysis is purely a numbers game; it involves applying statistical formulae to measurable data. A variety of data sources could be considered, including the historical price data of a stock or stock-specific details found in a company’s financial reports. Technical analysis is also data-driven but only considers market data, such as price history and trading volumes.
A subset of technical analysis is charting, which uses the annotation of price charts to identify trends and points where price might change direction. Alongside all these sits sentiment analysis, which uses a range of indicators to establish if the overall market mood is bullish or bearish and gives a steer on which way the broader stock market may be heading.
The different types of analysis all share the same aim – to identify trading opportunities. They just go about doing that in different ways. Those differences can lead to ideological spats between supporters of each approach; however, many investors instead embrace what each one offers and use them in conjunction with each other to develop a more rounded view on whether to buy or sell.
What is Intrinsic Value?
Intrinsic value is an asset’s perceived or calculated value, such as a stock listed on the ASX. The discounted cash flow (DCF) stock valuation technique, which is widely used, is an excellent example of a valuation model that can be used as part of fundamental analysis. It considers a company’s projected future earnings and is based on the fact that as a shareholder of a company, you are entitled to a share of those earnings. Using DCF analysis, you can establish whether the perceived risk of that revenue becoming an actuality makes buying the rights to it at the present time a good or bad idea.
In each scenario, it is possible to form a view on the intrinsic value of just one stock or run a comparative analysis of a group of stocks to find the best fit for your portfolio. It’s also possible to draw on other models used to calculate intrinsic value. These include absolute valuation, which collates key data about a firm, such as earnings growth, debt levels, capital expenditure, and profit margins. Relative valuation models use similar metrics but aim to establish if a stock is over or undervalued in relation to its peer group or the broader stock market.
Qualitative vs Quantitative Data
The terms qualitative and quantitative data explain how fundamental analysis involves gathering different types of information. Quantitative data points are the tangible numbers that report how a company is performing. This is not limited to but can include data found in a firm’s accounts, such as total expenditure and revenue, debt-to-cash ratios, and earnings per share. Qualitative factors are those which involve a greater degree of subjectivity. Different analysts may, for example, take opposing views on whether the installation of a new management team is a good or bad idea or whether the outlook for the sector the firm operates in is positive or negative.
Qualitative and quantitative data are both used in fundamental analysis. However, the different weighting given to the importance of different metrics and events explains how analysts studying the same firm can come up with different views on what that company’s stock price ‘should’ be.
Fundamental Analysis Metrics
You may have already noticed that there is scope for a wide variety of factors to be considered in any form of fundamental analysis. When designing your strategy, there are as many questions about what metrics to leave out as there are about which to include. Some of the more popular measures of a firm’s performance are detailed below.
- EV/EBITDA – These abbreviated terms refer to fundamental analysis tools based on Enterprise Value and Earnings Before Interest, Taxes, Depreciation, and Amortisation. It is a much-used metric popular with investors looking to establish a company’s intrinsic value. It considers the market capitalisation of a company’s stock and the amount of debt it holds on its balance sheet.
- EV/Revenue or Enterprise Value / Earnings – This multiplier considers the enterprise value of the firm and its total sales. It is widely used to value firms that have a negative EBITDA due to them being at the early stage of their growth cycle and not yet breaking even.
- P/E Ratio – This is a similar metric to EV/Revenue. Instead of EV, it uses the firm’s market capitalisation, which is derived from the price a stock trades at on an exchange.
- PEG Ratio – This ratio is based on the P/E ratio model but adds an extra step to the calculation used. It divides the P/E ratio by the EPS (Earnings Per Share) growth rate. It is a useful measure when trying to establish if a company is going through a growth phase.
The above metrics are helpful and popular tools because they have a proven track record of helping investors make the right decisions. They are, however, only part of fundamental analysis, and it’s important also to consider qualitative measures of performance and macro factors such as changes in government policy, weather events, and societal changes. All of which can impact the value of any asset.
Combining Fundamental and Technical
The differences between the various ways of identifying investment opportunities have resulted in something of a fundamental vs technical analysis debate. The truth is that those differences also mean that each approach brings something extra when they are used in conjunction with each other.
Technical analysis is popular with day traders and those following short-term strategies. Investors can use it to identify moments when market forces have caused price to momentarily over or undershoot or when new trends might be forming. Fundamental analysis is typically associated with investment strategies that take a long-term approach. Combining the two allows you to use fundamental analysis to establish if a stock is likely to go up or down in price and technical analysis to establish the optimal time to enter a trade based on that view.
In the below example, an investor may, at point ‘A’ on the chart, have used fundamental analysis to establish that Westpac Banking Corp is undervalued, but having used technical analysis, decided to wait for a buy signal at point ‘B’, which is in the region of the supporting trendline and the 50 Daily SMA.
Price chart – Westpac Banking Corp – Combining fundamental and technical analysis.
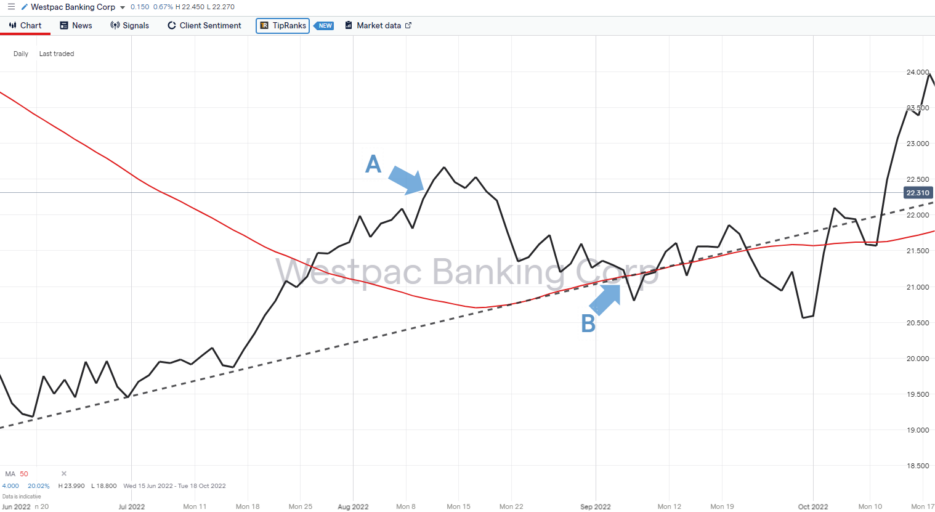
Source: IG
Final Thoughts
Using fundamental analysis makes intuitive sense. It considers the core aspects of a company’s business model and other elements that might affect a stock’s price. That’s why some investors base their decision-making entirely on fundamental analysis. Other investors may incorporate the ideas of other forms of research, and deciding which approach you take will ultimately come down to personal preference.
Whether you are new to trading or are an experienced investor looking to try new ideas, it is sensible to gain a better understanding of fundamental analysis and how it can impact stock prices.