
Newcomers to share market investing when forming their own investing approach learn the difference between “value” and “growth” stocks. While growth stocks are those whose financial performance is expected to outperform the overall market and its peers over time, value stocks are those whose financial performance over time is not reflected in its share price. In essence, a value stock is worth more than reflected in the current share price.
Value stocks sell at bargain prices since stock prices are not anchored in a company’s fundamentals, but rather in the perception of those fundamentals in the eyes of the investing community.

Some investors look for value stocks on the daily lists of stocks hitting 52-week lows, most often the result of market reaction to some adverse event.
Another and arguably more compete method is to rely on valuation ratios, a key component of the value investing strategy popularised by Benjamin Graham, with the most famous contemporary practitioner being Warren Buffet.
Top Australian Brokers
- eToro - market-leading social trading platform - Read our review
- IG - Extensive product array and user-friendly platforms - Read our review
- IC Markets - experienced and highly regulated - Read our review
- Avatrade - powerful trading tools - Read our review
Valuation ratios quantify the relationship between a stock’s price and some fundamental financial metric, like price, sales, cash flow, book value and others. Low ratios can be good indicators of an undervalued stock, with ratios under 10 considered the best signals.
Here are the basic valuation ratios investors can find on many financial websites.
Price to Earnings Ratio (P/E)
The P/E measures the price investors pay for a company’s past earnings per share. A P/E of 20 means investors are paying a price twenty times the company’s EPS. The P/E alone Is only one piece of a larger puzzle.
Price to Earnings Growth (P/EG)
The P/EG expands on the P/E by dividing the P/E by the company’s projected growth rate. Growth forecasts come from professional analysts who take other aspects of fundamental analysis into account in their forecasts, such as management strength, competitive landscape, and macroeconomic issues. A P/EG under 1.0 signals a potentially undervalued stock.
Price to Sales (P/S) and Price to Cash Flow (P/CF)
The stock price is divided by the company’s sales per share (P/S) and the P/CF by the amount of cash flow the company generates per share.
Price to Book (P/B)
A company’s book value is the difference between what a company owns and what it owes – tangible net assets minus liabilities. The P/B divides the current stock price by the company’s book value per share.
A P/E or P/CF ratio of 10 or below is a starting point to finding an undervalued stock. For the P/EG and the P/B the magic number is under 1.0. A P/B under 1.0 means an investor is paying less than the stock is worth. A P/EG under 1.0 (and especially under 0.5) suggests the investor is paying less than the future growth suggests the price should be. Other ratios need to be compared against a benchmark index. No single ratio will answer the question nor will ratios alone, without additional fundamental analysis.
Here are four ASX stocks that meet the valuation criteria.
- Beach Energy (ASX: BPT)
- Lindsay Australia (ASX: LAU)
- Perenti Ltd (ASX: PRN)
- Pilbara Minerals (ASX: PLS)
Beach Energy (ASX: BPT)
Beach Energy is an oil, gas, and gas liquid producer. The share price has dropped 6.4% over the last month following the announcement of quality issues affecting the cost estimates of a gas plant under construction. Year over year the stock price is up 7.3% as of 19 April of 2024 and down 21.8% over five years. The company has a solid track record of financial performance.
Beach Energy Financial Performance
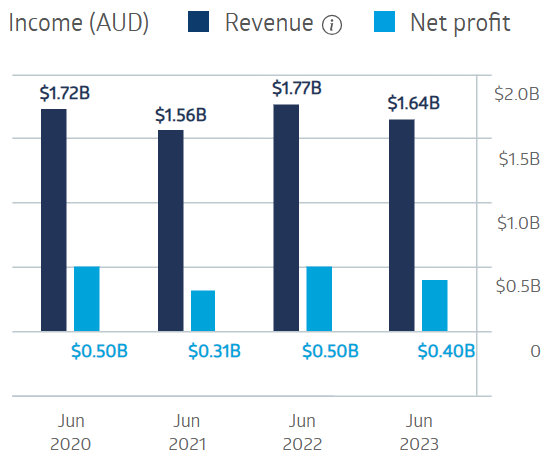
Source: ASX
Half Year 2024 financial results showed a 16% increase in sales revenue: a 10% drop in underlying net profit after tax, and a 100% increase in dividend payments from $0.01 to $0.02.
Beach has a P/S of 2.11, below the ASX benchmark index average of 2.42. Larger rival Santos (ASX: STO) has a P/S of 2.89.
The current P/CF of 4.20 is well below the index average of 10.19.
Beach has a P/E of 8.07, well below the 19.4 index average.
The P/B of 1.14 beats the index value of 2.24. A P/B of 1.14 translates into $1.53 per share, while the stock closed on 19 April at $1.61.
The P/EG – the only valuation ratio that attempts to predict the future – comes in under the 1.0 threshold at 0.63.
Lindsay Australia (ASX: LAU)
Lindsay Australia operates as an integrated provider of transport, logistics, and rural merchandise supplies and services in the food and food processing sectors. The company has a solid record of financial performance, turning in outstanding results in FY 2023.
As of 19 April the share price is down 17% but over five years the share price has risen 177%.
Lindsay Australia Financial Performance
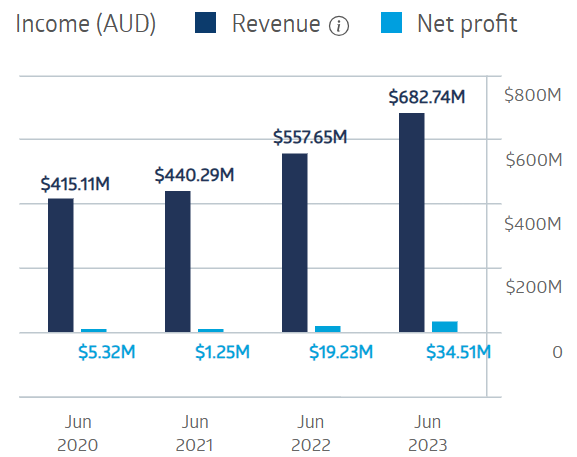
Source: ASX
For the Half Year 2024 :Lindsay reported record results across the board. Revenues increased 23.9%, underlying net profit after tax rose 13.9%, underlying EBITDA (earnings before interest taxes depreciation and amortisation) increased 21.7%, along with a 10.5% increase in dividends paid per share.
Lindsay’s valuation ratios strongly support its position as an undervalued stock.
The current P/S is 0.42 versus the index average of 2.42.
The current P/E is 8.84 versus 19.46.
The current P/CF is versus 10.19.
The current P/B is 2.19 versus 2.24.
The current P/EG is 0.27.
Perenti Ltd (ASX: PRN)
Perenti is a diversified provider of a variety of mining services to nine different commodities producers. The company has operations in 13 different countries spanning four continents.
Parenti’s revenues and net profit slipped a bit in FY 2022 but came roaring back, more than doubling net profit between FY 2023 and FY 2024.
The share price dramatically trails the company’s financial performance – down 27.2% year over year and 45% over five years.
Perenti Ltd Financial Performance
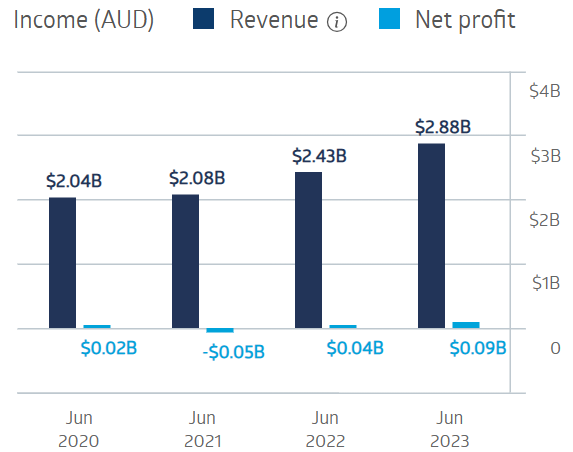
Source: ASX
Half Year 2024 results continued the growth pattern, with revenues up 13.5% and net profit up 63.5%.
Perenti’s valuation measures scream undervalued across the board,
The current P/S is 0.23.
The current P/E is 5.77.
The current P/CF is 1.77.
The current P/B is 0.49.
The current P/EG is 0.10.
Don’t Buy Just Yet
You will want to see this before you make any decisions.
Before you decide which shares to add to your portfolio you might want to take a look at this special report we recently published.
Our experts picked out The 5 best ASX shares to buy in 2024.
We’re giving away this valuable research for FREE.
Click below to secure your copy
Pilbara Minerals (ASX: PLS)
Pilbara is the largest lithium miner on the ASX, with a sole focus on the company’s wholly owned Pilgangoora Lithium-Tantalum Project in Western Australia, the largest hard-rock lithium operation on the planet. The company is partnering with South Korean steel producer Posco to create a plant for refining lithium ore into battery ready chemicals.
The Pilbara share price has risen and fallen in tandem with the price of lithium, now in a downturn, earning Pilbara the top spot on the ASX most shorted stock list. Year over year the share price has fallen 3.2%. Over five years the share price is up 420.4%.
The company’s FY 2023 revenue and net profit dwarfed the prior year yet coming in short of expectations sending the stock price downward following the release of results.
Pilbara Minerals Financial Performance
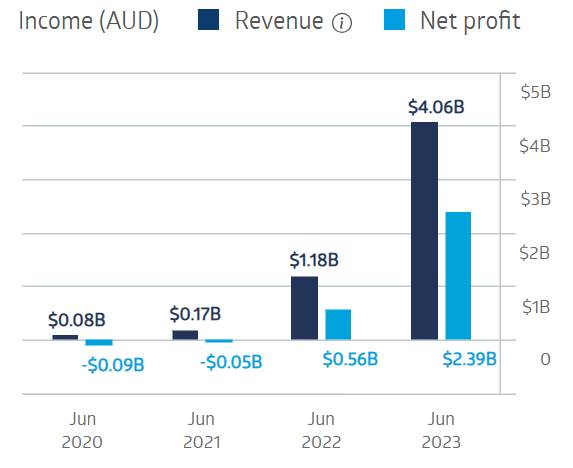
Source: ASX
Half Year 2024 results reported a 67% decline in the average realised price of lithium, reflected in the reported 78% drop in underlying net profit after tax and a 65% fall in revenues.
On two measures – P/S at 4.02 and P/B at 3.60 – Pilbara’s valuation exceeds the benchmark index. The P/E at 8.49, the P/CF at 8.9, and the P/EG at an astonishing low of 0.03 all indicate a potentially undervalued stock.
As the saying goes, “everyone loves a bargain.” Undervalued ASX stocks come at bargain prices since the company’s performance when compared to the price per share suggest – strongly in some cases – the investing community is not willing to pay what valuation measures of the company’s performance indicate the company is worth.
Finding undervalued ASX stocks is more than spotting stocks hitting 52-week lows. Valuation ratios such as the P/E, P/S, PCF, P/B and P/EG offer insight into the first part of the kind of fundamental analysis needed to find undervalued stocks – quantitative analysis.
There are other ratios to consider in assessing a company’ operational performance and financial health, like return on equity (ROE) and debt to equity. Finally, stocks that pass the quantitative measures need to be assessed qualitatively, looking at issues like the business model, competition, management strength, and sector strength and outlook.
