Support and Resistance – Technical Analysis Tools for Investors and Traders
Investors looking at a potential stock investment have two methods at their disposal for gauging the direction of the share price – fundamental analysis and technical analysis.
Fundamental analysis assumes a stock’s intrinsic value will determine share price movement over time. The analysis involves assessing the company’s financial performance, operating efficiency, competitive environment, and management quality.
Technical analysis assumes those issues are already known by the investing community and are reflected in the current share price. In technical analysis, all that matters is historical price movements and volume data. The belief is price movements are determined by market sentiment about the stock. There are a host of technical analysis tools for predicting price movements with the support and resistance of a particular stock key among them.
Top Australian Brokers
- Pepperstone - Trading education - Read our review
- IC Markets - Experienced and highly regulated - Read our review
- eToro - Social and copy trading platform - Read our review
What is Support and Resistance
Stock prices follow the economics laws of supply and demand, with the supply side representing willing sellers and the demand side representing willing buyers. When demand exceeds supply there are more buyers than sellers and the price goes up. When supply exceeds demand there are more sellers than buyers, driving the price down.
Support and resistance spots the point at which the supply/demand dynamics shifts following a change in market sentiment. Think of support and resistance as a floor defining a low point where sentiment shifts upward and resistance as a ceiling where sentiment shifts downward.
When market sentiment around a particular stock is positive buyers outnumber sellers. When market sentiment turns negative, sellers outnumber buyers. This simple chart from the website fidelity.com/learning-center/trading-investing/technical-analysis/support-and-resistance using the company’s trading platform Active Trader Pro® illustrates the basics of support and resistance levels.
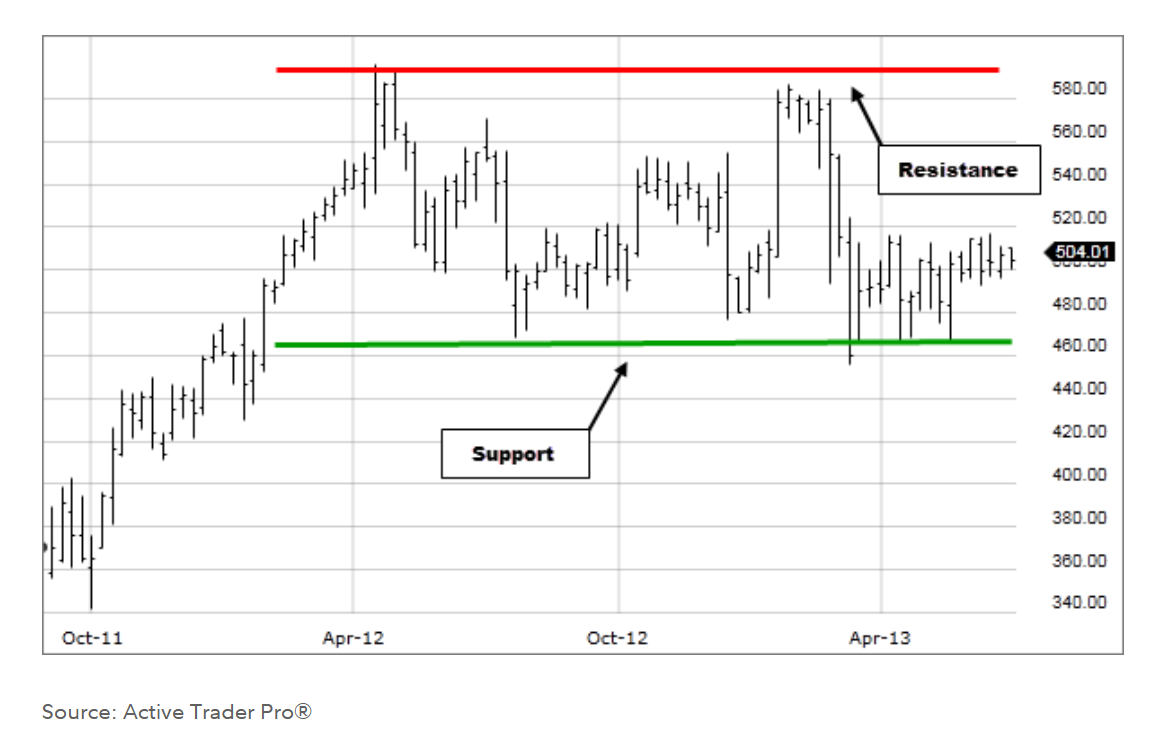
This simple example shows a stock with resistance at about the $580 price point over the time period. Buying enthusiasm lags at that point with market sentiment shifting negative as sellers begin to dominate. The price finds support at around $460 when buyer interest returns driving the price up.
Over time support and resistance levels change with shifting market sentiment, but the pattern remains – prices will rise till they meet resistance at higher levels and then fall until they hit new support levels.
Support and resistance levels provide entry and exit points for both short-term traders and long-term investors. How then does an average retail investor find support and resistance levels?
How to Identify Support and Resistance Levels
Investors experienced in using technical analysis tools have several from which to choose to identify support and resistance levels. Newcomers might be better with simpler methods, such as trendlines.
The procedure calls for connecting the support and resistance levels seen in a price movement chart in horizontal lines. Examining price movement history will show the patterns of a stock price approaching but not exceeding a high or a low. Experienced technical analysts advise using simple line charts as opposed to candlestick charts.
Line charts display only the closing price of a stock while candlestick charts included extreme highs and lows, which can be misleading as they often reflect momentary market reactions.
In reality support and resistance levels reflect market sentiment. A stock price bouncing off its support indicates buyers enter the market in the belief the stock is undervalued and oversold. A stock price bouncing off the resistance indicates sellers are outnumbering buyers in the belief the stock is overvalued.
A trendline can serve as an indicator a stock price is about to breakthrough its support or resistance when the line shows repeated hits at both levels, with each weakening the support or resistance setting them up for a breakthrough.
From the website tutorials.topstockresearch.com here is an example of a support trendline.
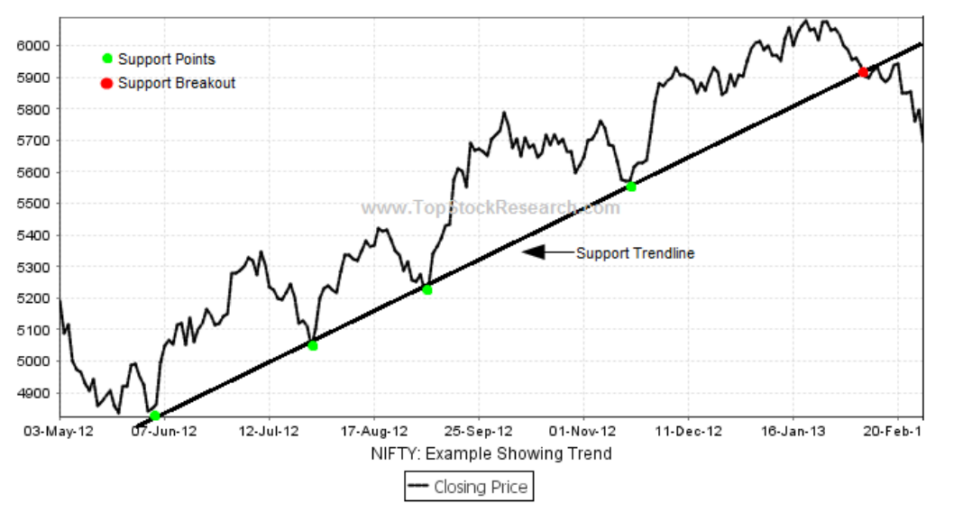
Investors looking to buy at support might limit the trendline to support, but you can see resistance points on this chart as well. Investors accumulating at the bounces off support would be alerted to sell as the price breaks through its support.
Here is another chart from the same website showing a resistance trendline.
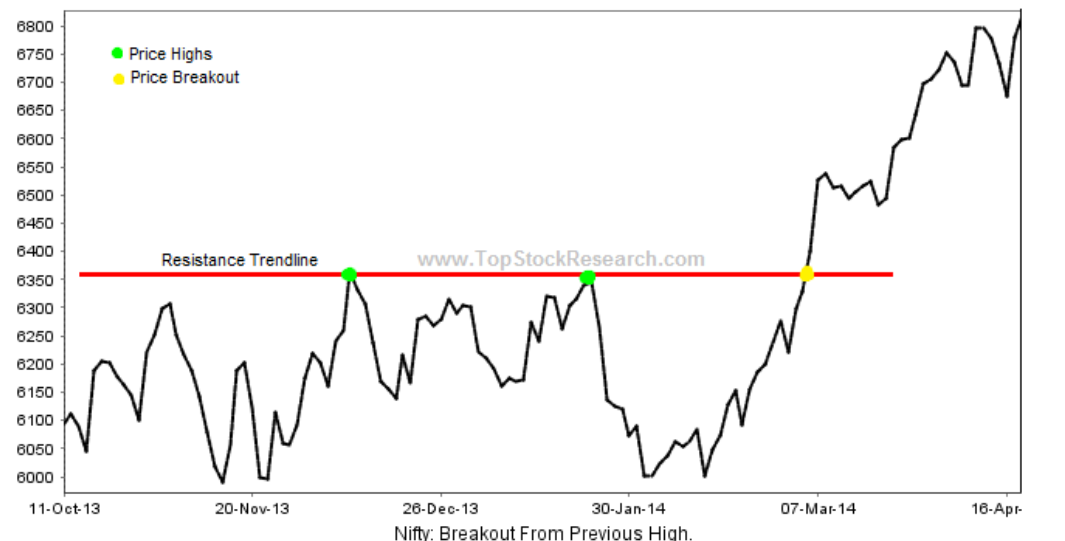
Finally, here is an example of both support and resistance trendlines on a candlestick chart from the website instagram.com/share_market.
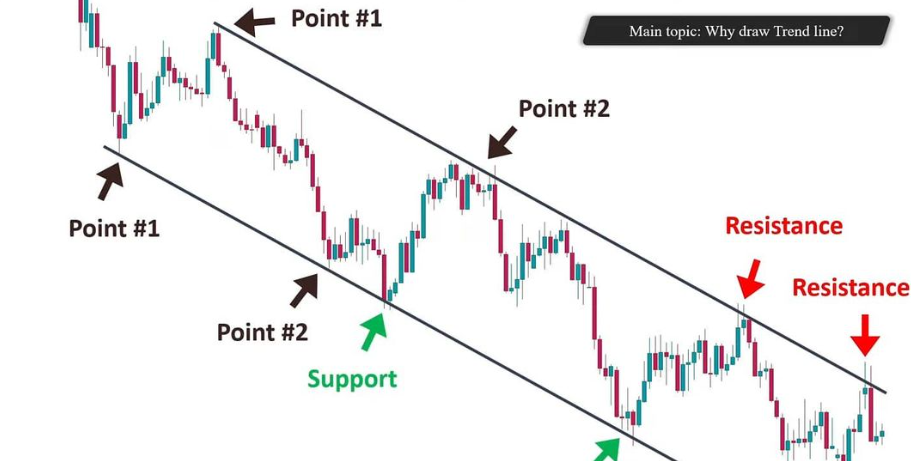
Source: Instagram.com share_market
Trendlines follow market movements, so in an uptrend the support trendline would connect the higher lows. In a downtrend, the lower highs are connected to create the resistance trendline.
Many investors experienced in technical analysis feel Fibonacci Retracement levels are the best method for identifying support and resistance levels. However, learning how to apply the Fibonacci Retracement level method is somewhat complex and takes time and practice to learn.
Trading Using Support and Resistance
Trading using support and resistance levels can come on the bounce or the break.
Long-term investors spotting changes in resistance can buy at an entry point that fits their investing strategy. Traders can buy on the bounce to resistance and sell on the bounce to support.
Market sentiment can break both resistance and support levels, eventually establishing new resistance highs and support lows. When sentiment breaks through either resistance or support levels, a continuation of the upward buying pressure or the downward selling pressure is likely. Both traders and investors could then short a stock that has broken through its support and buy stocks breaking through their resistance until buying pressure subsides and new resistance levels take hold.
One of the challenges of relying on resistance and support levels is determining if the breakthrough is actually a testing of the resistance or support rather than a true breakthrough.
Some expert technical analysts advise investors and traders to think of resistance and support as “zones” rather than hard numerical values. Investors new to support and resistance concepts would be well advised to review price movement charts over varying time frames from a variety of stocks to spot the repetitive patterns of bounce and break. The naked eye can see a stock price that repeatedly reaches a level without breaking through.
Over time many stocks repeatedly hit a high but fail to climb higher – a resistance level. Stocks also bounce off a low price but fail to drop lower – resistance. Identifying support and resistance can serve as entry and exit points and shorting opportunities. Among the methods for identifying support and resistance, drawing trend lines connecting highs and lows are the easiest for newcomers to technical analysis to employ. For more experienced investors, Fibonacci Retracement Levels are considered one of the best.


