
Comparing BHP Group (ASX: BHP) and Rio Tinto (RIO) in 2025 and Beyond
Australia has long been known as “the lucky country” due to our abundance of the natural resources needed for the rest of the twenty first century and beyond.
The ASX has some of the best mining companies in the world, key among them the two largest by market capitalisation – BHP Group with a market cap of $207 billion dollars as of 21 February of 2015, down from $215 billion in mid-year, and Rio Tinto with a market cap of $44.6 billion, down from $47 billion in mid-year.. Aussie investors are lucky to have easy access to both on the ASX, but which represents the better investment as of late February of 2025?
If you are looking for answers from the analyst community, 3 months ago the Wall Street Journal had a consensus HOLD rating on the stock, up to OUTPERFORM as of February 21 of 2025.. RIO’s consensus rating at the WSJ fell from BUY 3 months ago to OUTPERFORM. and Marketscreener.com maintained its consensus OUTPERFORM rating the two stocks. Yahoo finance Australia is now reporting a BUY on both companies, raising BHP from a HOLD 3 months ago.
For more answers we need to dig into the metrics many investors consistently rely on to make investment decisions, like share price appreciation, financial performance, and dividend payments along with the most common valuation ratios dividing overvalued and undervalued stocks. These are quantitative and vary over time, with some valuation ratios requiring “here and now’” analysis while historical financial performance, share price movements, and dividend payments over time are also valid concerns.

Top Australian Brokers
- Pepperstone - Trading education - Read our review
- IC Markets - Experienced and highly regulated - Read our review
- eToro - Social and copy trading platform - Read our review
In addition there are qualitative comparisons, beginning with what do each of them mine right now, and how do they see the future.
While both are vertically integrated and mine diverse commodities, there are some differentiations between them. Both have shed their thermal coal assets, but BHP still mines, processes, and sells metallurgical coal used in steel making. Iron ore is the largest commodity produced from each. The differences emerge on how they are preparing for the future.
Both have acknowledged the need for resources vital to a world hurtling towards more digitisation in the midst of a battle for produce cleaner energy.
BHP is betting its future on copper, nickel, uranium, molybdenum, along with flagship commodity iron ore, gold, and silver. The company is developing the Jansen Potash project in Canada to meet exploding demand for agriculture. BHP shed its oil and gas and thermal coal assets with` the intent of streamlining its focus.
Australia maintains a list of minerals critical for our “modern technologies, economies, and national security.” BHP currently mines two minerals on the list –molybdenum and nickel.
Along with iron ore, copper, and borates, Rio mines five minerals from the list – alumina, lithium, titanium, scandium, tellurium, along with diamonds, salt, and ferrous metals.
The financial performance of the two companies over the last four fiscal years is another starting point for comparing the two companies.
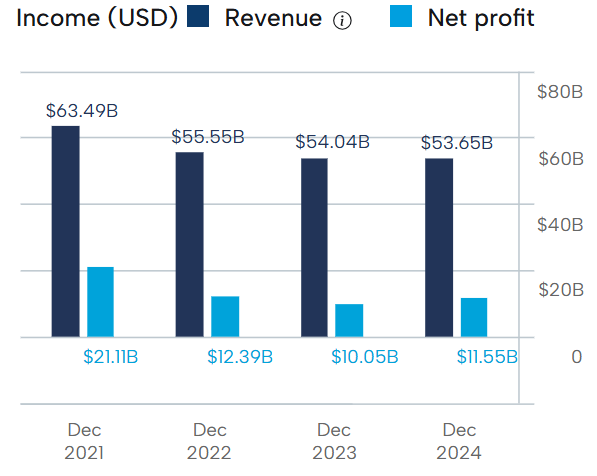
BHP Financial Performance
Source: ASX 21 February 2025
Half year results reflected the volatility of commodity pricing in 2024. Despite a 44% increase in EBITDA (earnings before interest taxes amortisation and depreciation) from copper production, the slide in both iron ore and metallurgical coal price dragged overall EBITDA down by 11% along with an 8% fall in revenues. Dividend payments were reduced by 30%.
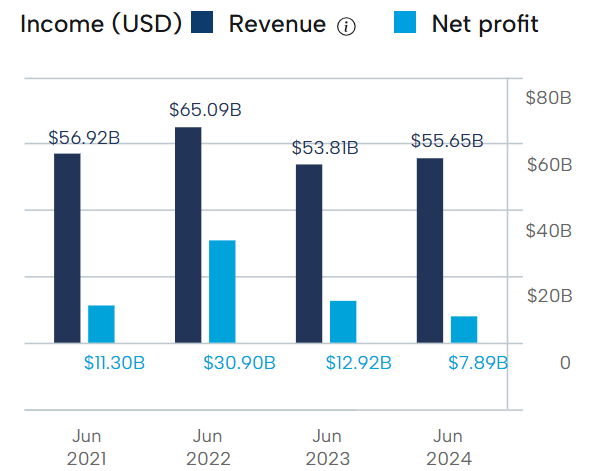
Rio Tinto Financial Performance
Source: ASX 21 February 2025
Although there are differences between commodities mined, both Rio and BHP derive the majority of their revenue from iron ore. Rio’s FY 2023 revenues fell 2.7% with net profit falling 18%.Although revenues fell again in FY 2024 – down 1% –profits rose 15%.
Share Price Appreciation
With both companies facing the same challenging economic conditions, the share price of both fell year over year – with BHP now down 7.3% and RIO essentially flat – down 0.7%.
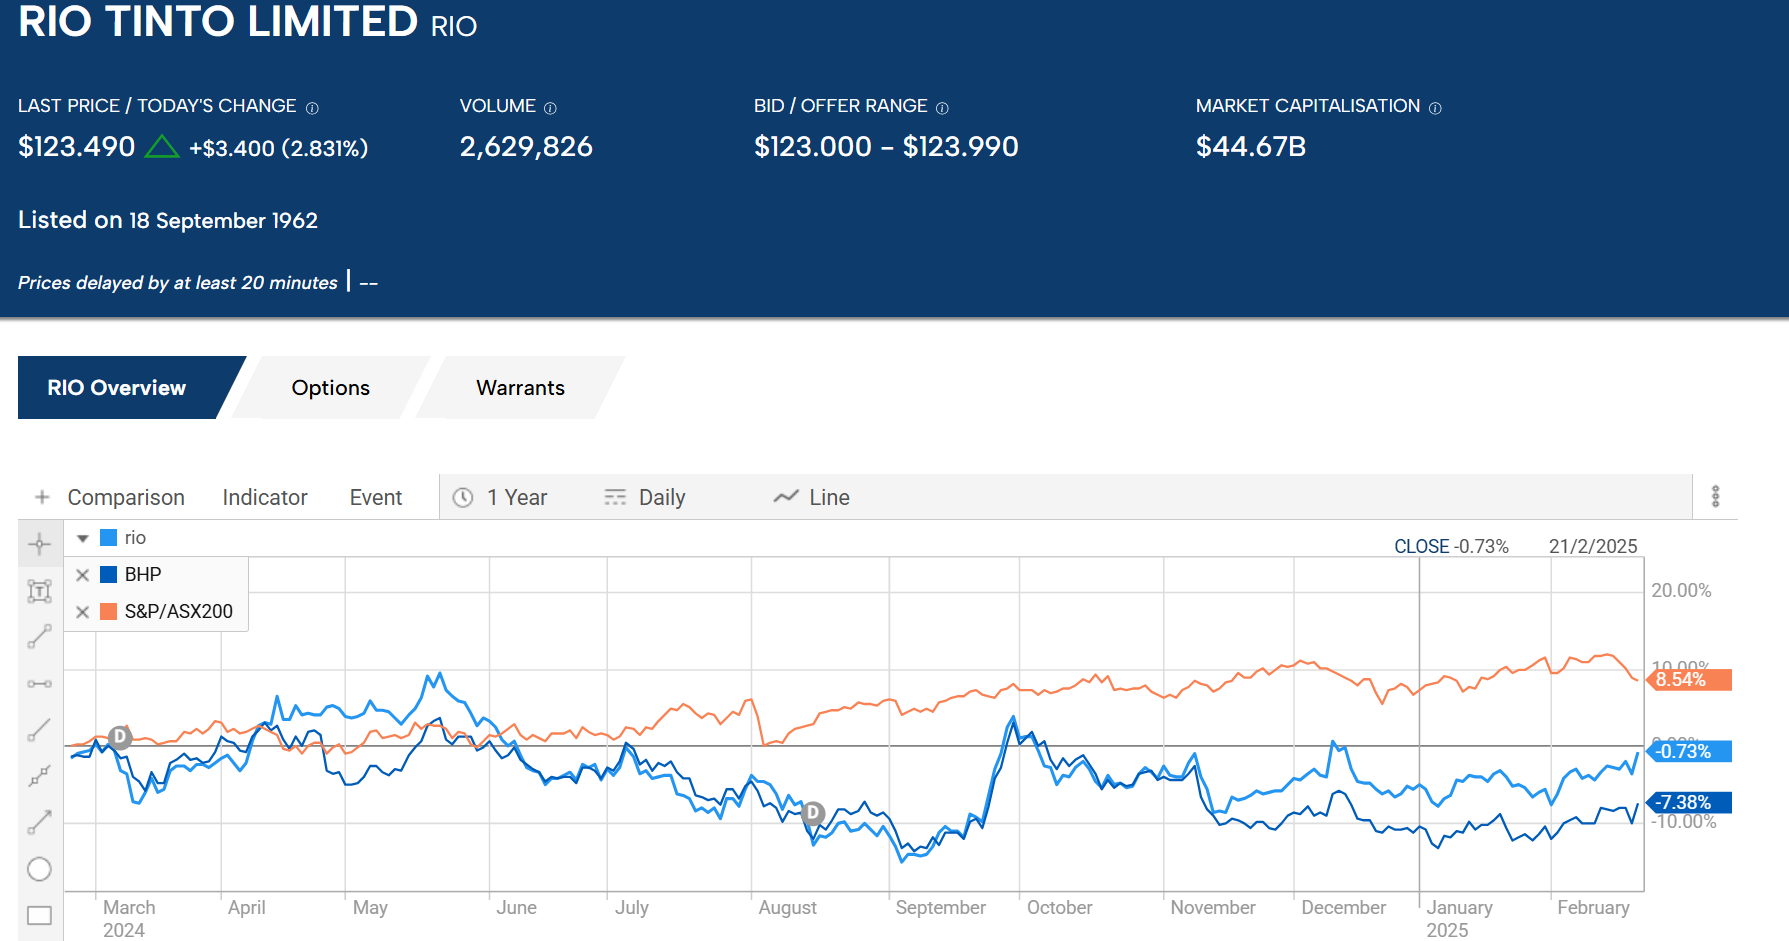
Source: ASX 21 February 2025
Over five years the BHP is up 37.9% while RIO is up 41.5%.
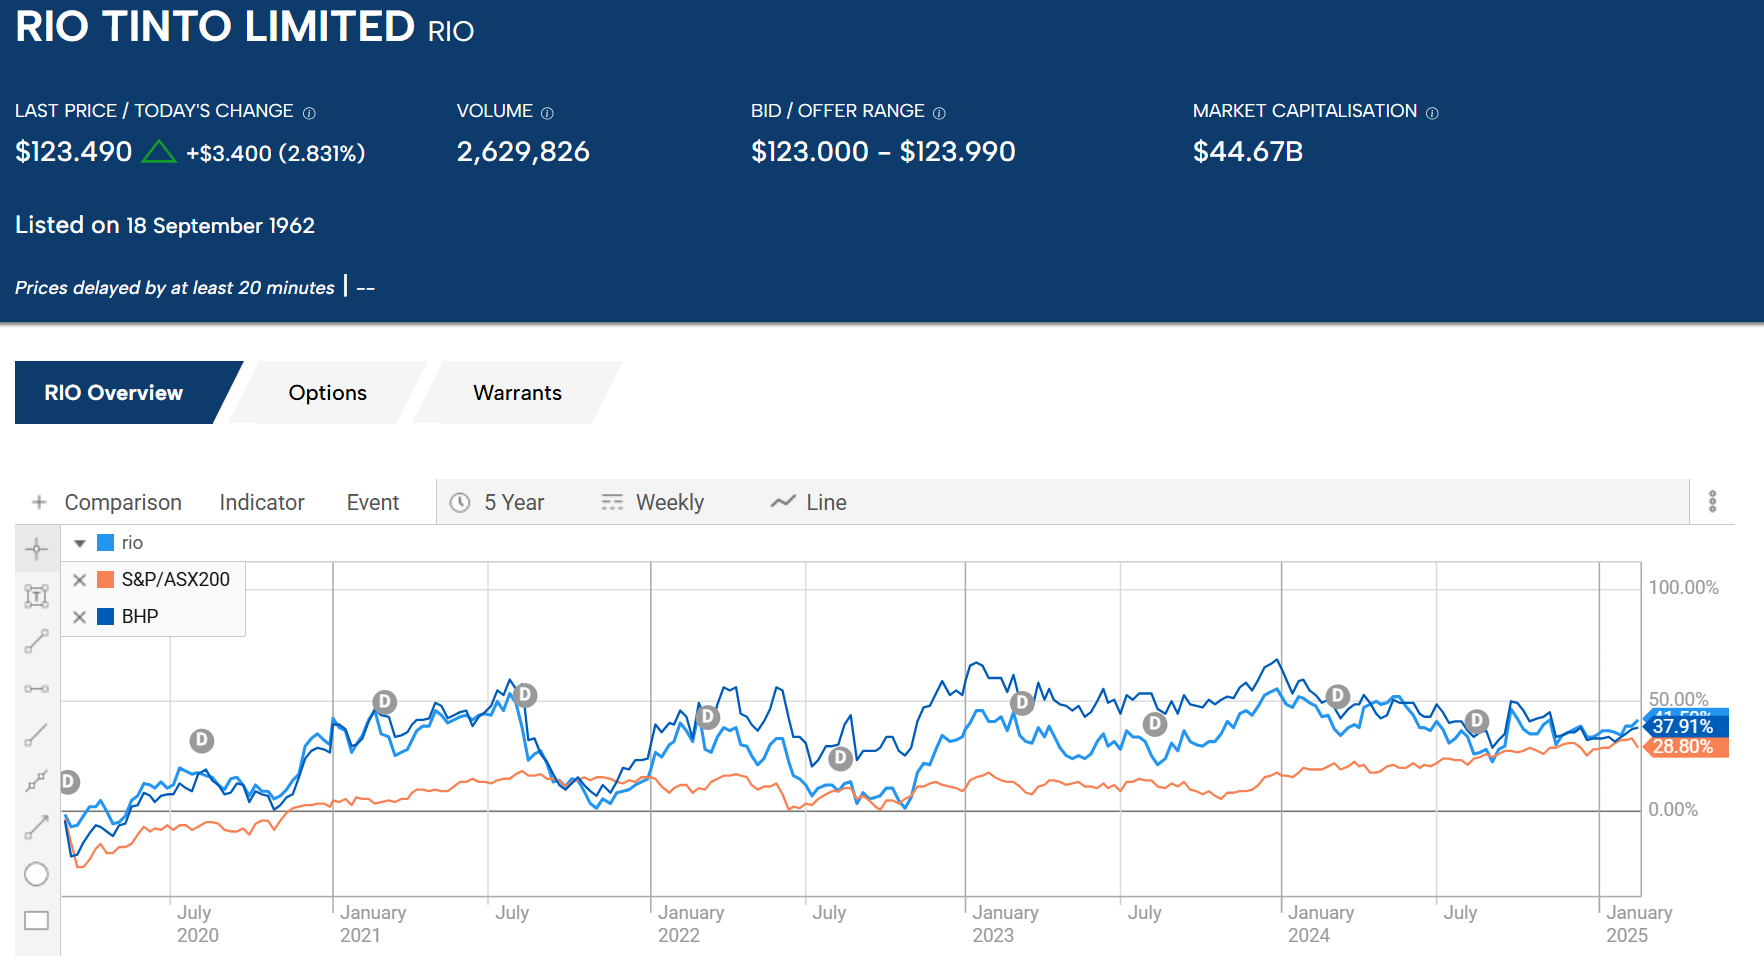
Source: ASX21 February 2025
Over ten years the Rio share price has appreciated 91.7% while BHP trails, up 57.25.
Dividend Payments
Rio’s five-year average total dividend yield is 6.42%. BHP’s five-year average total dividend yield is 6.35%. Neither company cut dividends in the first year of COVID but both cut dividends in FY 2023. Rio reduced its FY 2022 dividend payment of $6.86 per share to $3.93 per share with the current dividend payment at $6.54. BHP cut its FY 2022 dividend payment from $3.29per share to $1.74 per share with the current payment at $2.21 per share.
Valuation Ratios – the Price Multiples
Of all the valuation ratios used to assess an investment, the price multiples are the simplest to understand and the most common among ordinary investors. These ratios compare the current share price of a stock to various financial metrics, with low ratios indicators of potentially undervalued stocks and high ratios indicators of potentially overvalued stocks.
The P/E, or price to earnings ratio is a favorite of retail investors. The ratio is calculated by dividing the current share price by the earnings per share, either from the prior fiscal year or on a trailing twelve-month basis. High P/E ratios indicate an investor may be paying too much for the stock.
Most valuation ratios need a point of comparison, or a benchmark index. For ASX stocks in the materials sector in which both BHP and RIO are classified the index P/E is 19.41.
For FY 2023 BHP had a P/E of 13.31 while the current P/E is 12.14 and the five-year average P/E is 12.82.
For FY 2023 Rio had a P/E of 17.24 while the current P/E is 11.52 and the five-year average P/E is 10.12.
Bargain stocks generally have P/Es under 10.0 although some value investors accept 15.0 as a benchmark for undervaluation.
The Price to Book ratio (P/B) compares the current stock price against the value of the company’s assets per share. A ratio under 1.0 is a rare bargain.
The benchmark P/B for the materials sector is 2.23. Rio’s current P/B is 2.26 and BHP’s is 2.86.
The price to cash flow (P/CF) compares the current share price to the company’s cash flow per share. The benchmark index P/CF is 10.22. Rio’s current P/CF is 8.60 while BHP’s is 6.91.
The Price to Forward Earnings ratio and the Price to Expected Growth ratio (P/EG) do not have a benchmark index since the denominator – forward earnings per share or earnings growth – are company specific forecasts from industry specific analysts. A P/EG under 1.0 represents a bargain stock.
In both cases the ratios tell investors how much they are paying for future earnings per share or future earnings growth. Five-year averages tend to smooth out economic downturns.
Rio has a five-year average price to forward earnings ratio of 9.17 and a five year average price to earnings growth ration of 0.13. BHP has a five-year average price to forward earnings ratio of 10.73 and a five-year average price to earnings growth ration of 0.71.
In a country with natural resources aplenty, it should come as no surprise that Australia’s top two ASX listed mining companies – BHP Group and Rio Tinto – rank third and fourth in the world based on market capitalisation, revenue, and earnings.
Australian investors have easy access to both through local brokerage outlets, but which one is the better investment right now?
BHP has streamlined its operations in an effort to focus on the minerals most crucial for a changing world. Rio Tinto has a broader base of commodities mined, including more of minerals deemed crucial by the Australian government.
Rio has a better historical track record in both financial performance and share price appreciation along with superior valuation ratios in most cases.