
Elliot Wave Theory – Stock Market History Repeats Itself
In the 1930’s a professional accountant named Ralph Nelson Elliot relied on both the psychology and sentiment of stock market investors to develop a theory of stock price movements that contradicted the prevailing opinion of the day that markets were inherently random and chaotic. Elliot believed the greed, fear, optimism, and pessimism of market investors created `predictable patterns in price movement over time that recycled and repeated.
Eliott’s theory states share market movements come in five patterns or “waves,” with five waves moving in the prevailing direction of stock prices and three appearing as the prevailing price trend begins to reverse course. The five “impulse” waves include smaller “sub-waves” that extend the applicability of the theory from long-term to short-term movements over weeks, months, and years for short term traders, and hours and minutes for day traders. The three “corrective” waves also have “sub-waves’ buried within them.
Proponents of Elliott Wave Theory believe the waves have the potential of predictive power, guiding investors to spot upcoming moves in market action – from temporary corrections to full-blown bear markets.

How to Trade with Elliott Wave Theory?
The goal of all investing strategies is to make a profit by determining when is the right time to buy and when is the right time to sell.
Top Australian Brokers
- Pepperstone - Trading education - Read our review
- IC Markets - Experienced and highly regulated - Read our review
- eToro - Social and copy trading platform - Read our review
The biggest challenge to trading with Elliot Wave Theory is correctly interpreting the complexity of the wave patterns to predict which way the market is going – continuing in an upward trend or reversing course into a downturn.
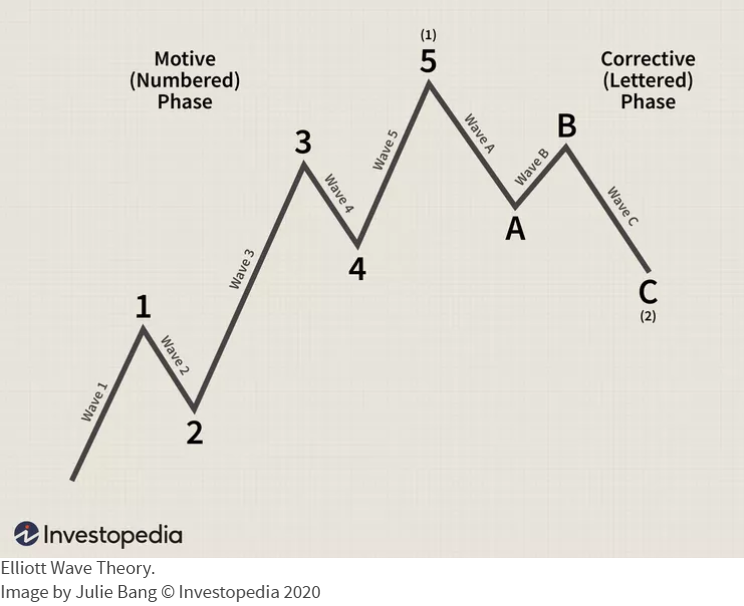
Newcomers to Elliot Wave Theory begin their education with simplified charts like the one below from investopaedia.com, where the impulse waves are called “motive” waves.
Waves 1, 2, 3, 4, and 5 make up an impulse as they continue in an upward trend, and waves A, B, and C make up a correction as a downward trend begins. Note that waves 2 and 4 do run against the trend but both represent “higher lows” meaning the price dip is less than the previous price dip. Wave B signals the start of the correction as it represents a “lower high” where the price has risen but falls below the previous uptick. Wave C completes the corrective move as it represents the first “lower low” in the pattern.
This basic pattern of five impulse waves followed by three corrective waves constitutes a wave 1 “degree” in the theory with the three wave correction constituting a wave 2 degree. Degrees indicate the level or magnitude of the wave pattern by timescale and size of the trend. Degrees range from decades to minutes.
A full blown description of Elliot Wave Theory would include Elliott’s nine degrees of waves:
- Grand Super Cycle
- Super Cycle
- Cycle
- Primary
- Intermediate
- Minor
- Minute
- Minuette
- Sub-Minuette
Trading with Elliott Wave Theory is not for the faint of heart as taken alone it requires some subjective interpretation of where the trend is at the moment. Traders with the time to closely monitor their investments might buy when the impulse waves continue and sell out or short a stock with a corrective wave in progress.
The Pros and Cons of Elliott Wave Theory
Proponents of Elliott Wave Theory point to the predictive successes of an Elliott disciple, Robert Prechter, who embraced Elliot’s view that mass psychology could predict patterns in the movement of stock markets. He is credited with reintroducing the theory to market insiders, has publishing fourteen books built on the theory and enhancing it. Prechter used Elliott Wave Theory to accurately predict the 1982 bull market and the 1987 market crash. While he predicted the burst of the credit bubble contributing to the Great Financial Crisis, he missed the bull market that began in 2002.
Critics point to the complexity of the theory and its inherent subjectivity when used as a practical tool for predicting market movements. Newcomers to technical analysis attracted to the theory may be surprised when clicking the “Indicators” button found on the top of the price movement charts found on most financial websites.
Clicking opens a menu of more than thirty tools of technical analysis that can be superimposed on the price movement chart of a target stock, but Elliott Wave Theory is not there. Why not?
The theory is too complex and subjective to be standardized and automated as are the technical indicators making the list. People like Prechter have made a career of understanding and applying Elliott Wave principles. While technical indicators like moving averages and relative strength indicators can be numerically calculated, accurately charting Elliott Waves requires experience and a degree of specialised knowledge.
A comparison of the results of wave pattern identification from different Elliott Wave analysts can yield different results, highlighting the speculative nature of using pattern identification to make real-life financial buy and sell decisions.
Finally, some would argue that the fact financial software creators have not tackled the task of automating the theory reflects low demand from investors.
Combining Elliott wave theory with Other Indicators
Many traders use Elliott Wave Theory in conjunction with other technical indicators targeting the same end – identifying market trends and corrections or reversals in trend. One such indicator that is included in online charting lists of technical analysis indicators is the MACD ((Moving average convergence/divergence.)
What is the MACD?
The MACD is used to identify buying entry points and selling exit points by gauging changes in the strength, direction, momentum, and duration of a trend in the price of a targeted stock. The MACD line is created using the difference between two exponential moving averages – one of 26 days in duration and the other of 12 days in duration to then create a signal line – with a signal line calculated by charting the difference of the two averages over nine days.
Trends are identified when the MACD line crosses above or below the signal line. Traders combine the MACD with Elliott waves by first identifying the current wave pattern. Superimposing the MACD indicator can confirm the direction and strength of the trend while a divergence can spot a trend reversal when the price of the stock and the MACD move in the opposite direction.
Accountant Ralph Elliott developed his wave theory in the 1930s with one of his disciples – Robert Prechter – adopting and further developing the theory, bringing it into the 21st Century. Elliott disagreed with the prevailing view of the early 1900’s that price movement of stocks was random and chaotic. He relied on the psychology of investors to discover prices actually moved in predictable patterns that repeated over time.
He saw price movements coming in “waves” with the classic pattern consisting of five impulse waves with trend momentum followed by three corrective waves reversing the course of the trend.
Trading on the ASX with the theory can be complex, with most proponents combining Elliot Wave principles with another technical indicator that also looks for trend momentum, direction, and reversals. The Moving Average Convergence Divergence (MACD) is one of the favorites.