
For most share market investors around the world, fundamental analysis is the essential strategy for identifying worthy investment targets. In the long distant past, the process began with investors combing through a company’s financial statements reported to the investing public – the Balance Sheet, the Income Statement, and the Statement of Cash Flows – to determine the company’s financial health, operating efficiency, and value.
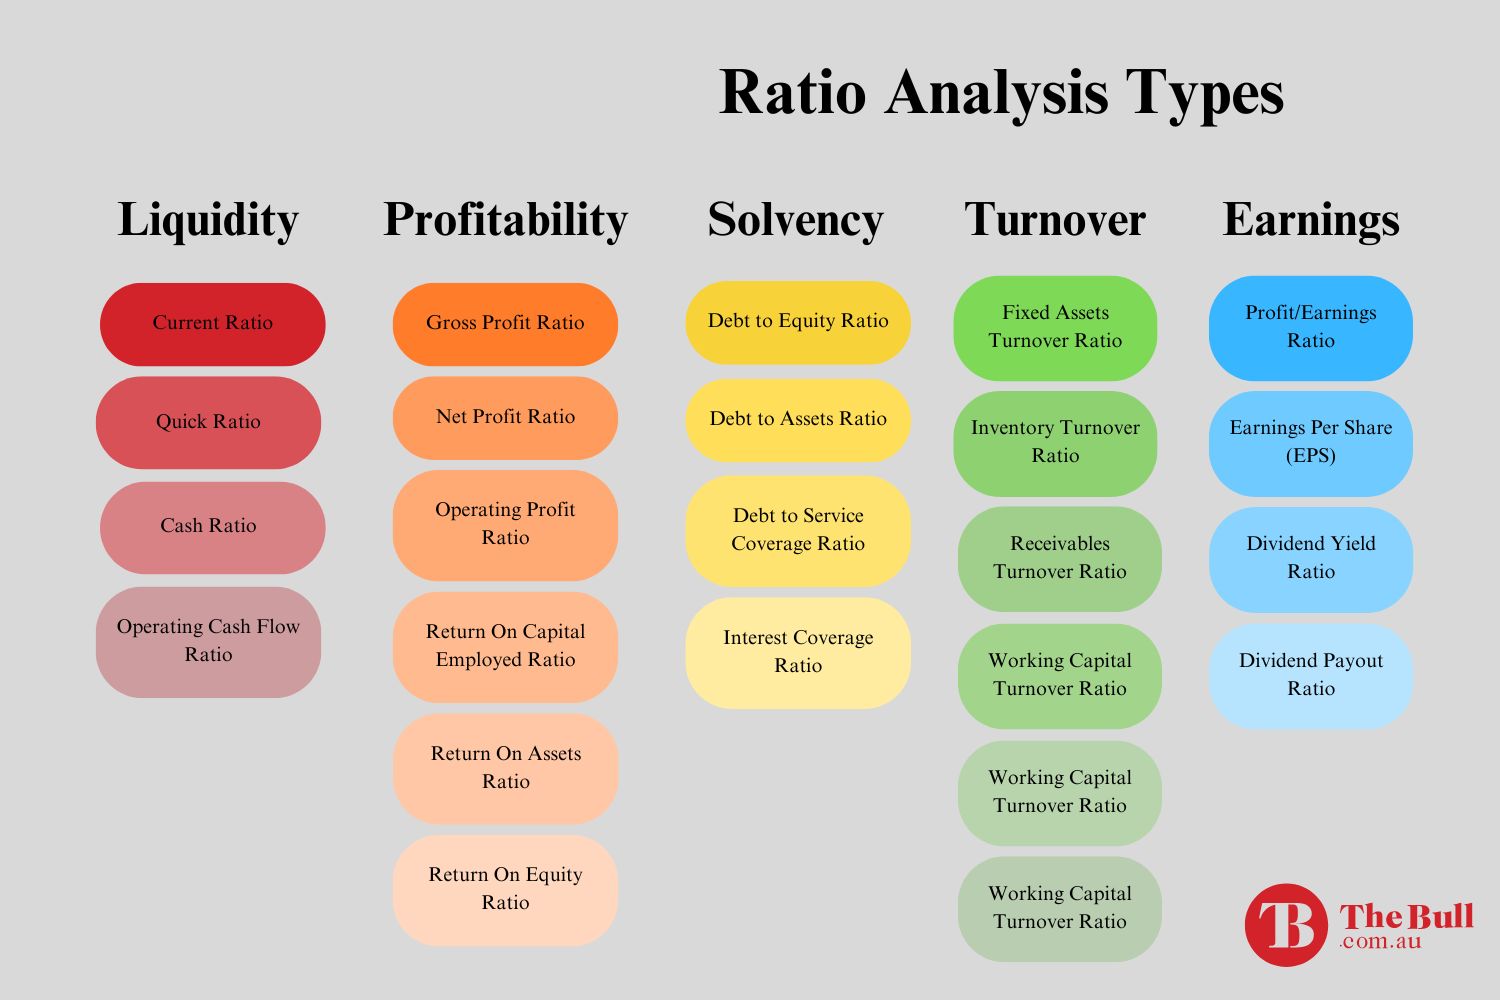
Today, market analysts do the combing of the statements, producing a broad array of ratios derived from values found in the financial statements. That array can include twenty four or more ratios for investors to consider.
Top Australian Brokers
- Pepperstone - Trading education - Read our review
- IC Markets - Experienced and highly regulated - Read our review
- eToro - Social and copy trading platform - Read our review
Some market experts refer to profitability ratios as management effectiveness ratios and earnings ratios as valuation ratios. Given the enormity of the task, it is little wonder that many investors look for “magic bullets” among the throng that quickly get to the heart of a company’s potential.
While the majority of investors appear to favor the Price to Earnings (P/E) Ratio as a prime “magic bullet” candidate, a smaller number gravitate towards the Return on Equity (ROE) ratio.
What is Return on Equity?
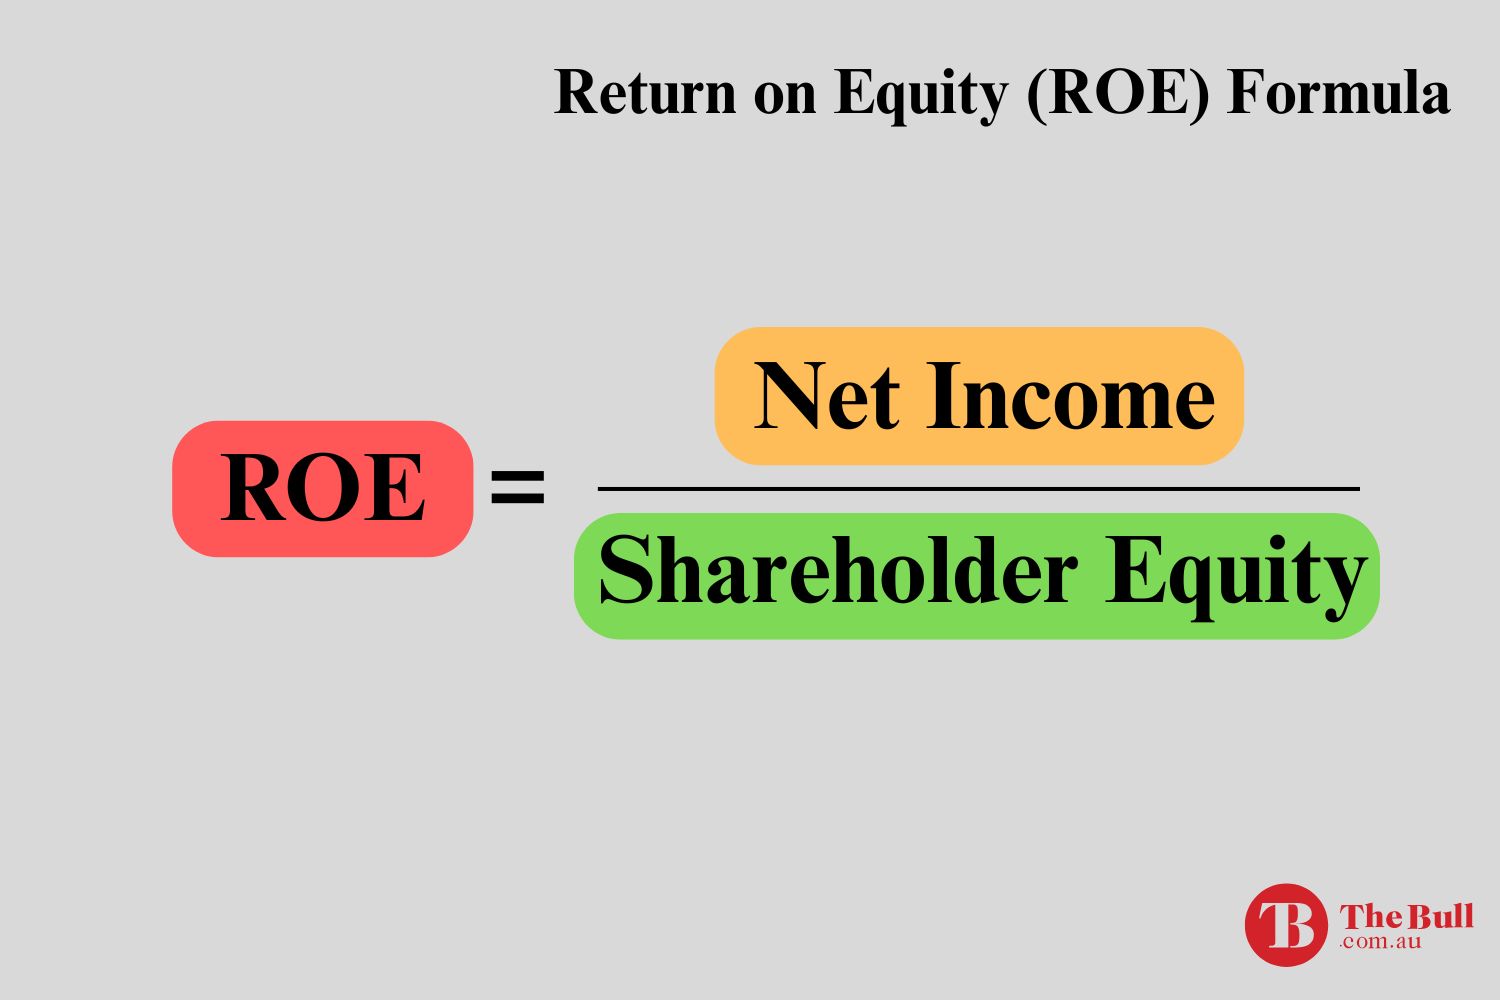
Return on Equity is calculated by dividing a company’s net income over a period of time by its total shareholder equity. Shareholder equity is the net worth of a company – its total assets minus its total liabilities.
Return on Equity tells investors how well the company is using the money they have invested in the company. ROE is a favorite of many investors since it reflects what stock picking is all about – profitability that leads to shareholder returns.
Although the ROE is not a measure used in isolation, ROEs between 15% and 20% are indicators of a good investment depending on how they compare to the sector in which they operate and peer companies.
For example, as of 25 February of 2025 the ROE for BHP Group (ASX: BHP) is 25.02%, with a five year average ROE of 31.78%. The 25 February for the ASX Material sector in which BHP operates is 22.1%. Rival Rio Tinto (ASX: RIO) has an ROE of 18.4% as of 25 February of 2025, with a five year average ROE of 26.8%.
Is Return on Equity the Best Way to Pick Stocks?
In reality, there are no magic bullets when it comes to equity investing, although many investors view the Price to Earnings Ratio as a quick indicator of a worthy investment, if not a magic bullet.
What make the ROE a powerful tool is its ability to not only measure profitability, but also profitability in relation to resource., There are other profitability or management effectiveness ratios.
Return on Assets (ROA) includes debt and physical assets like land, buildings, equipment , and cash as corporate assets. Cyclical companies frequently take on debt for operating expenses between cycles.
Return on Invested Capital (ROIC) begins with net profit after tax and then divides that value by invested capital, measuring how effective the company is at using capital for profitable investments. Effective use of this ratio requires calculating the company’s weighted average cost of capital (WACC), including common and preferred stock, bonds and all forms of other debt. Investors should look for companies with a ROIC that exceeds weighted average cost of capital.
In the absence of “magic bullets” the most effective use of the ROE is a road sign that says PROCEED WITH CAUTION. Based on a comparison of both the current and five year average ROE for BHP Group against the Materials Sector and rival Rio Tinto, BHP would be the better choice for further analysis.
There are no magic bullets when it comes to equity investing, although many investors view the Price to Earnings Ratio as a quick indicator of a worthy investment
The Drawbacks of Return on Equity
Like many financial ratios, the ROE is subject to accounting irregularities. In a single year, net income can be impacted positively or negatively by one-off charges, making a review of five year average metrics a veritable requirement.
In addition, debt can artificially inflate the ROE of companies that rely excessively on debt to fund operations. This makes a review of the stock in question’s Debt to Equity Ratio a must.
The Debt to Equity Ratio is calculated by dividing a company’s total debt — including loans, bonds, and all other forms of debt – by its total shareholder equity. A high ratio is an indication the company is relying heavily on debt to finance operations.
Newcomers to share market investing can be surprised when they uncover companies with high return on equity ratios with a stagnant or declining share price.
The sad truth is that the price of a stock is not driven up or down based on the fundamentals of the company, including a history of profitability. The price is driven by investor perception of a company’s future.
If investor sentiment sours on a company’s prospects, the price will go down. Companies that have yet to generate a dime in revenue, much less profit, will see their share price go up if the investment community believes in their future growth.
Stock prices are governed by the economic law of supply and demand. On any given day, if investor demand to buy a stock exceeds the supply of investors willing to sell, the price will go up. If the supply of investors looking to sell a stock exceeds the demand of investors looking to buy the stock, the price will do down.
Many market experts disagree that price is the dominant variable in investing, claiming that company fundamentals matter.
Many market experts disagree that price is the dominant variable in investing, claiming that company fundamentals matter.
This explains investor enchantment with the P/E ratio and the other valuation ratios than incorporate the price investors are willing to pay for a share of the company.
Yet there is an entire approach to share market investing – technical analysis – that believes price is all that matters. The underlying assumption is that the current stock price reflects all the information available about the stock in question at the time, including fundamentals.
Technical analysis studies historical price movements looking for patterns trat are likely to repeat. Like the wealth of ratios available to proponents of fundamental analysis, there are literally dozens of technical analysis tools readily available in online trading platforms and most financial websites.
Although the search for that elusive “magic bullet” metric that points to a potentially successful investment, there are metrics available through ratios from leverage to profitability to solvency to turnover to earnings.
Among these, the most popular and arguably useful are the earnings or valuation Price to Earnings Ratio (P/E) and the profitability or management effectiveness Return on Equity Ratio (ROE).