
On 27 June of 2022, many newcomers to share market investing who had heeded the world view that gold provides a safe haven for investors in troubling economic conditions got yet another shock.
On that date the third largest gold miner listed on the ASX – Evolution Mining (EVN) – issued a market update lowering its Full Year 2022 production guidance for the second time in the past three months – this time down to 640,000 ounces.
The March Quarter update issued on 19 April of 2022 lowered guidance again, down from a previously announced 670.000 ounces to 650,000.
Evolution has a history of low cost production, with industry leading AISC (all in sustaining costs.) The June update showed an increase in AISC. The share price fell close to 30%, dragging down most of the gold miners with it.
The advice to go for the gold as a safe port in the storm has always come with caveats. There are multiple elements to an economic “wall of worry.”
Top Australian Brokers
- Pepperstone - Trading education - Read our review
- IC Markets - Experienced and highly regulated - Read our review
- eToro - Social and copy trading platform - Read our review
The price of gold fell around 4% in 2021 but many analysts issued bullish predictions going into 2022, among them global investment banking powerhouse Goldman Sachs from the US. On 29 June Goldman raised its 2022 forecast again, this time to USD$2,500 per ounce. In early January Goldman’s forecast was USD$2,150.
Gold prices got off to a hot start in 2022 as some of the main drivers of the price of gold took hold, as inflationary pressures raised their ugly heads. Goldman and others were basing their bullish views on inflation and events in Ukraine.
However, there are other drivers of the price of gold. The case for gold is strongest when its status as an asset without the risks associated with other investments is unchallenged. This view does not fully take into account rising interest rates and their impact on government bond yields.
Gold began the new fiscal year dropping and analysts predicting gold is headed for its third consecutive weekly fall. All this may come as a surprise to investors who glanced at a 7 June article in the US financial website cnbc.com, and stopped reading at the headline: Gold rises as inflationary pressures mount, yields fall.
The text of the article hinted at the coming surprise when it pointed to rising interest rates as potential headwinds for gold as higher rates make fixed investments attractive.
The US Federal Reserve Bank along with the vast majority of Central Banks in developed countries have been raising interest rates to combat inflation, and bond yields are now going up in response. Why should an investor take the risk with volatile gold prices when investments with attractive fixed returns are readily available?
The following price movement chart tracks the gold price in US dollars over the past two years:
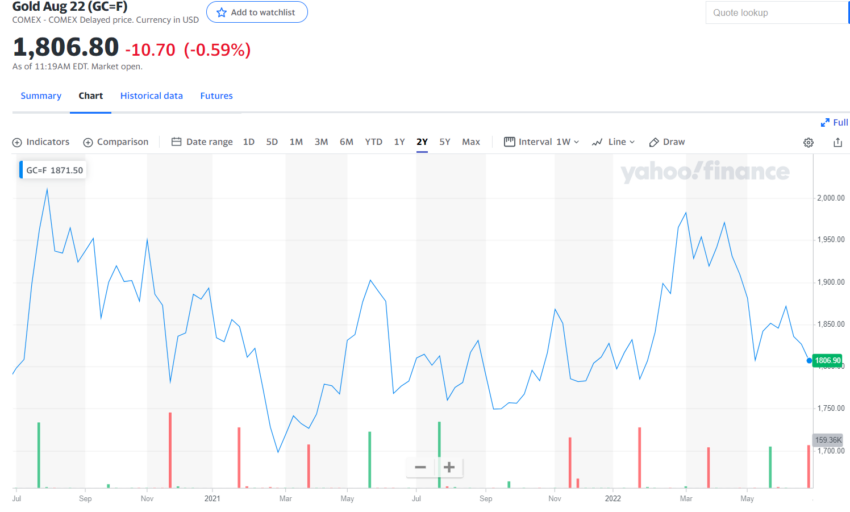
The other driver sometimes overlooked is the strength of the US dollar, the world’s de facto currency. As has happened with the price of gold, one of several factors influencing the strength of the US dollar has taken center stage – monetary policy. Low interest rates erode dollar strength. The current dollar rally has been and is likely to continue to be fueled by the stated commitment from the US Fed to raise interest rates.
On 17 March of 2022, the US Fed raised interest rates by 0.25% and the price of gold began to fall. As April drew to a close the price of gold dropped for the second month as the US dollar continued to gain strength.
Many investors also abandoned their holdings in gold miners, while others looking for investments in volatile markets are reluctant to take a chance on the gold mining sector.
While common sense suggests the price movement in gold futures and that of the gold miners should move in relative concert, this is not always the case. The simplest way to demonstrate is to compare price movement charts over time.
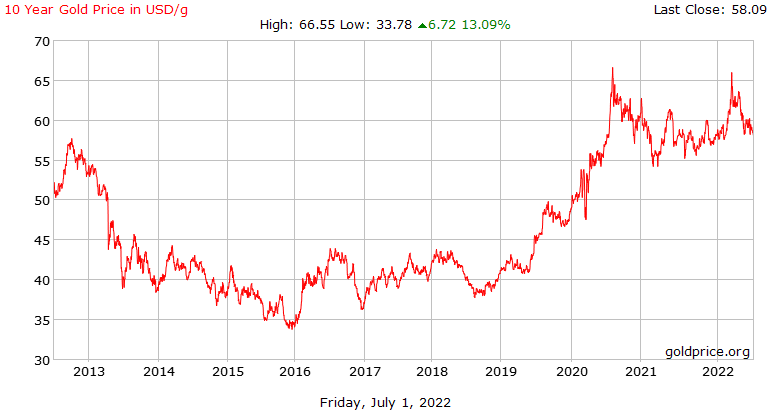
Here is a ten year chart from the website goldprice.org tracking the price of gold per gram in US dollars.
Now here is a ten year price movement chart for the second and third largest gold miners on the ASX – Northern Star Resources (NST) and Evolution Mining (EVN).
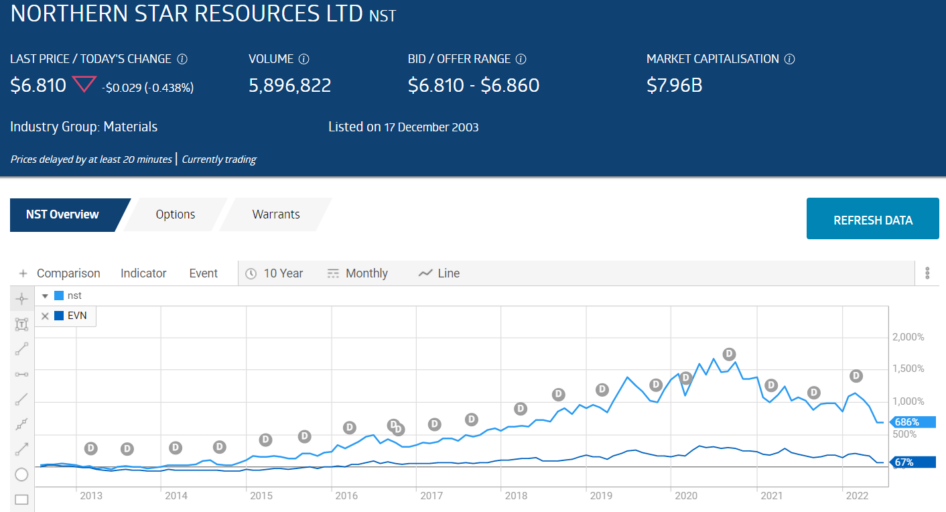
In 2013 while the price of gold began heading in a three-year downturn, both these miners were on the rise. Both are primarily Australian producers, benefiting from operating costs in lower value Australian dollars while sales revenues comes from higher valued US dollars..
The Northern Star story is well know to many active investors. The company went on a shopping spree right around the start of the decade that pushed the company’s output into the stratosphere, second only to the largest miner on the ASX Newcrest Mining (NCM).
Northern Star has two major gold mining production centres here in Australia and one in the US state of Alaska, with three operating mines in each of the Australian production centres. The Pogo Production Centre in Alaska was acquired in 2018, funded by a $175 million dollar equity raise to institutional investors.
The company maintained both revenue growth and profit growth from FY 2019 to FY 2021, despite pandemic related issues. Half Year 2022 Financial Results saw a 69% revenue increase and a 43% rise in NPAT (net profit after tax), although underling profit from operations declined due to a depreciation and amortisation revision following the merger between Northern Star and ASX listed gold miner Saracen Minerals.
The company reiterated its guidance for the Full Year 2022 and has expansion activities underway at four of its operating assets.
To strengthen its balance sheet Northern Star has sold off some of its assets, including a July of 2021 transaction with rival Evolution Mining for a collection of producing mines in Northern Star’s Kalgoorlie Production Centre.
Evolution had been struggling with decreasing production and the deal is expected to propel Evolution towards its goal of one million ounces of gold by 2024. The acquired mines allow Evolution to further reduce its already low ASIC by the consolidation of its existing mines with the Northern Star acquisitions, with the close proximity lowering hauling costs.
The following table includes share price and growth metrics for both companies.
|
Company (CODE) Market Cap |
Share Price 52 Week High 52 Week Low |
Share Price % Change Year to Date Year over Year |
Earnings Growth 5 Year 10 Year |
Dividend Growth 5 Year 10 Year |
Total Shareholder Return 3 Year 5 Year 10 Year |
2 Year Growth Forecast Earnings Dividends |
|
Northern Star Resources (NST) $7.9b |
$6.81 $11.59 $6.79 |
-27.63 -32.64% |
-221.0% -234.1% |
+22.1% +25.3% |
-17.8% +11.1% +25.6% |
+68.9% +19.2% |
|
Evolution Mining (EVN) $8.3b |
$2.38 $4.96 $2.35 |
-41.38% -48.26% |
+15.4% +14% |
+32.5% N/A |
-19.9% +4.1% +7.5% |
+6.9% -37.6% |
The five and ten year earnings growth rates for Northern Star seem to imply the company has not been profitable. The figures are from Morningstar.com.au, which uses diluted earnings per share, not the basic earnings per share reported by most companies. Additional shares added to the registry dilute earnings as a mathematical certainty. Diluted EPS includes the impact of equity raises over time and the presence of financial instruments like stock options, warrants, and convertible bonds that could be converted into shares. The Pogo acquisition diluted the earnings per share.
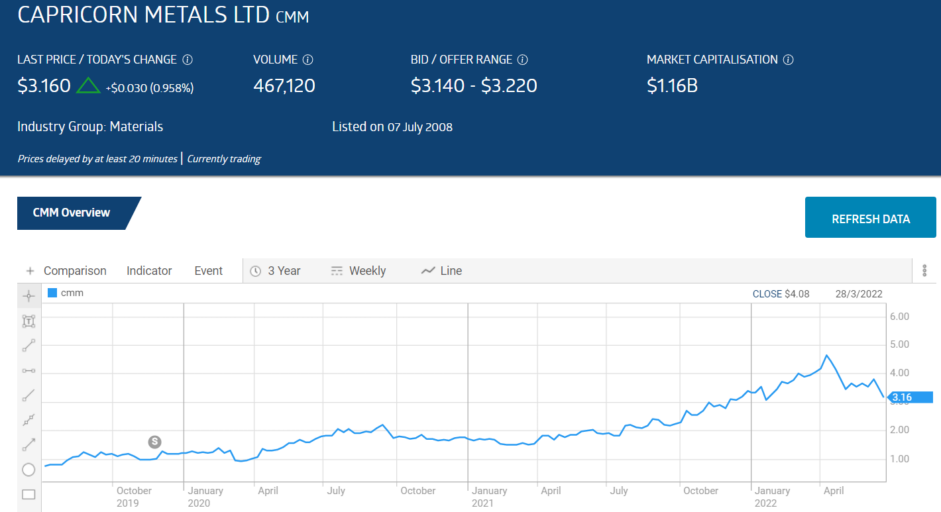
There are other smaller gold mining companies on the ASX but few can compete with the performance and promise of Capricorn Metals (CMM).
In 2019 the company began construction on its Western Australian Karlawinda Gold Project (KGP). In June of 2021 Capricorn produced its first ounce of gold from the KGP. Within a month, the company acquired the shuttered Mt Gibson Gold Project (MGGP).
The share price shot up close to 20% on the news, as the company’s initial resource estimates for the project came to 2.08 million ounces of gold.
Since it began producing the KGP has been steadily increasing production, improving from its earlier production of 24,329 ounces of gold by the close of the first quarter of FY 2022 to 30,316 ounces by the end of Q2 at the end of December of 2021 at an ASIC of $1,048 per ounce.
Capricorn’s Half Year 2022 Financial Results saw the company’s maiden profit of $51.8 million dollars, following a loss of $2.3 million in the Half Year 2021. Drilling at the Mt Gibson project is well underway, with management calling the results “very encouraging.” Capricorn expects to hit its FY 2022 gold production guidance of between 110,000 and 120,000 ounces. On 30 May the company announced the acquisition of an exploration project from Gascoyne Resources Ltd. The Mumbakine Well Project borders Capricorn’s existing Karlawinda Gold Project.
Since the construction of the KGP project began in 2019, the Capricorn share price has risen 385%. The two year growth forecast for the company’s earnings per share is 400%, from a loss of $0.014 in FY 2021 to a positive $0.32 in FY 2023.
In a 17 June note to investors, brokerage firm UBS issued an optimistic outlook for the sector, with an expressed preference for “newer mines with newer infrastructure.” UBS upgraded Evolution to a BUY rating and included Northern Star in its preferred gold names.
Another stock that made the UBS preferred list was Gold Road Resources (GOR).
The company owns 50% of the Gruyere gold mine in conjunction with Gold Fields Ltd. The Gruyere mine began producing gold in 2019, with forecasted production to reach 350,000 ounces per year by 2023.
The company fits the UBS standard of new developments with exploration projects underway in the “underexplored and highly prospective” Yamarna Greenstone Belt in Western Australia’s north-eastern Goldfields. Gold Roads has a two year earnings growth forecast of 87%, from $0.042 in FY 2020 to $0.14 by FY 2023.