
Volume and Price Action Go Hand in Hand
The first time a newcomer to share market investing checks a price movement chart for a potential stock to buy it is likely they concentrate on the price action and ignore the volume bar chart at the bottom of the chart.
Most people who have never bought or sold a stock use common sense that says a stock with price improving is a solid company with strong revenues and profits and future growth potentials. That may be a reality, but in the world of share market investing it is not reality that drives the price of a stock upward or downward, it is perception.
When the majority of investors believe the stock has a great future, buying goes up and so does the price even if common sense suggests the company’s performance does not justify its high share price. Similarly, when a majority of investors perceive a company to be in trouble or lacking in future potential, the price will go down.
Top Australian Brokers
- Pepperstone - Trading education - Read our review
- IC Markets - Experienced and highly regulated - Read our review
- eToro - Social and copy trading platform - Read our review
The Significance of Volume
How market participants perceive a stock is characteristic of sentiment –”a view or attitude toward a situation.” It is the collective sentiment of investors in the ASX that drives prices up and down. Volume, or how many shares are traded in a day, corroborates sentiment.
High volume signifies investor enthusiasm about the stock with investors rushing in to buy. Low volume signifies pessimism about where the stock is going, and medium volume comes close to signifying indifference.
From the financial website of brokerage firm Charles Schwab, this simple chart illustrates how volume is an important clue for traders:
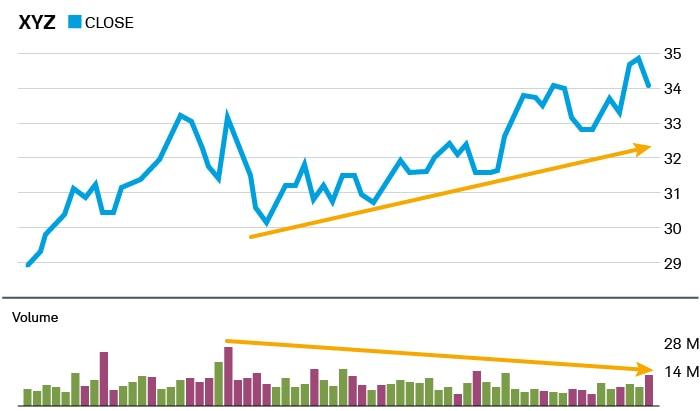
Source: Charles Schwab & Co
The bar size indicates the volume level and the color the price action of the day, with green bars for when the stock price closes higher than its opening price and purple bars for when the stock price closes below its opening price.
You can see the highest purple bar correlates with a sharp drop in the share price. It might seem contradictory but the remainder of the chart that shows the share price rising is not a good sign for potential investors. High volume either up or down signifies the strength or momentum of the price action. The share price rising on declining volume suggests a weak trend and momentum with waning investor interest.
The next chart from Schwab shows the opposite – a rising share price with rising volume:
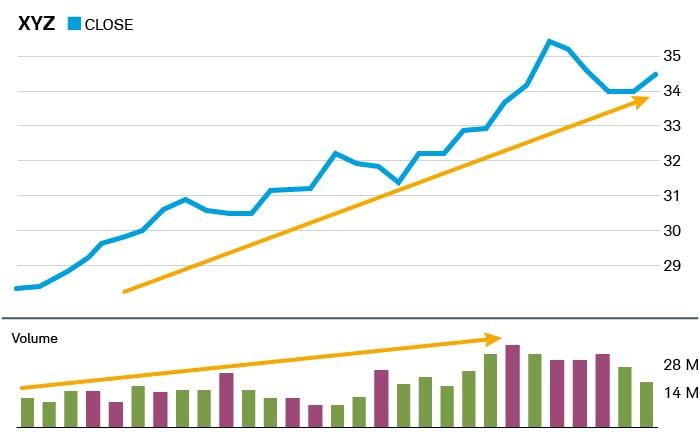
Source: Charles Schwab & Co
Volume Trading Strategies
There are a number of technical analysis indicators that can be employed as volume trading strategies but even without them volume gives an investor clues.
First, volume is a sign of liquidity. So if a stock you are considering shows volume bars barely visible on the price movement chart, this is a bright red flashing signal to stay away. It signifies extremely low interest and few buyers, meaning if you invest it could be challenging to exit the trade.
Fundamentally inclined investors with no technical analysis skills can use volume as a springboard to further research to uncover the possible cause of the volume. This is especially true in the case of huge spikes in volume that generally follow a blockbuster announcement from the company. Momentum investors may get in to ride the wave until declining volume signals a weakening momentum and a time to exit.
Technical traders like to refer to volume as a means of tracking “money flow.” Non-technically inclined investors can employ a strategy of tracking the volume of a targeted stock over a period of time looking for patterns. This monitoring strategy can identify changes in the volume pattern as BUY or SEL Signals.
Example Volume Trades
As is the case with many trading strategies, the flashing signals may not be accurate or may come too soon or too late. From the Charles Schwab website again here is a crystal clear example of an accurate volume trade.
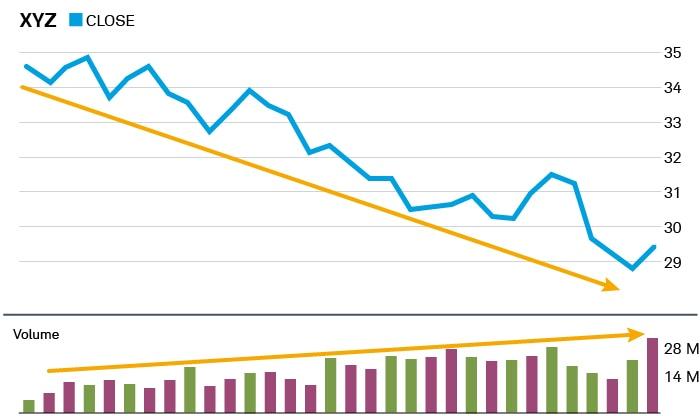
Source: Charles Schwab & Co.
Any investor monitoring the “XYZ” company can see rising volume coupled with declining share price shows investors are increasingly losing faith in the stock.
In the real world the picture is not always so clear. From the ASX website, here is a six month price movement chart for a penny-stock mining company Caprice Resources (ASX: CRS)
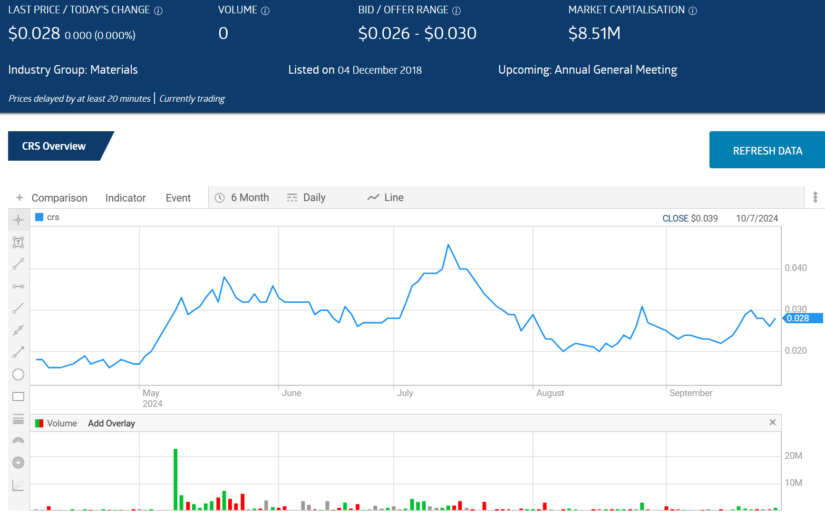
Source: ASX
On 6 May the company went into a trading halt, emerging on 9 May with the announcement the company had acquired a 90% stake in the Banta Rare Earth Elements (REE) project in Western Australia. The upward spike was quick and strong, signaling investors monitoring the stock the upward movement was likely to continue. When volume decreased indicating waning investor interest the price went sideways.
A July announcement of the closing of the Banta acquisition saw an increase in both volume and price, but most investors would know the lackluster volume increase would not support the price rise, providing a SELL signal for earlier investors.
On-Balance Volume (OBV) is one of the most used volume technical analysis indicators. ASX price movement charts, like most on financial websites, have an Indicator button that when clicked displays a long list of technical analysis indicators. OBV is under Volume Indicators which is added to the price chart with a simple click of a button.
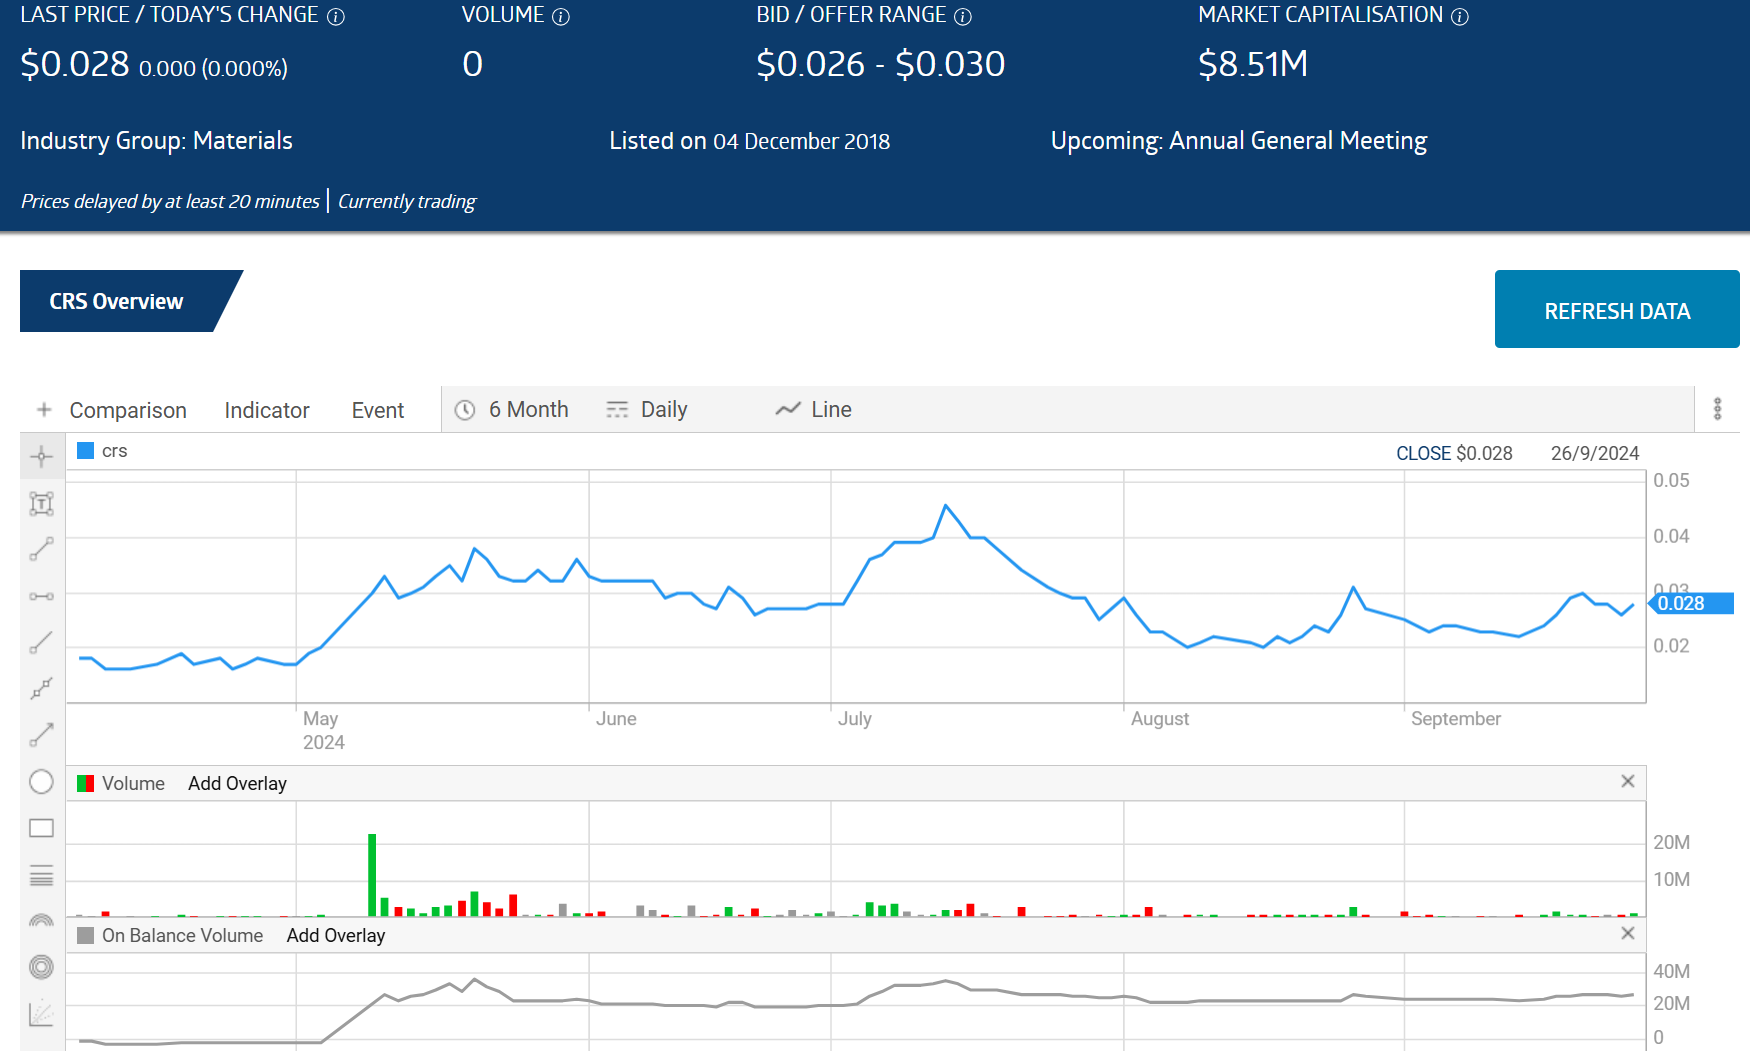
Source: ASX
The indicator confirms the potential signals seen on the chart.
The Pros and Cons of Volume
Volume is a technical indicator with a resounding “Pro” in volume’s ability to provide a measure of strength and momentum. Volume also measures liquidity with stocks generating a bare minimum of interest, leading to ultra-low volumes. Translation for investors is low liquidity leads to difficulties in exiting the trade.
Each volume level – high, medium ,or low –provide clues to investors who take the time to closely monitor a stock. Medim or low volume suggests minimal interest from the investing community sending a clear Stay Away signal of at best a Wait and See signal. Volume can spot trend reversals giving investors SELL signals.
The cons of volume trading are essentially the same as all trading approaches. There are no “sure things” in share market investing. Adding layer upon layer of technical indicators to a stock’s share price does not guarantee the accuracy of the signal. Timing is arguably the biggest con as BUY, SELL, or STAY AWAY signals can come too early or too late.
Volume is a powerful trading tool that provides clues to investors about which way the price action of a stock is likely to go. High volume indicates heightened enthusiasm of investors eager to sell while low volume indicates heightened enthusiasm of investors eager to sell.