The ideas put forward by some of history’s greatest investors withstand the test of time. Some retail investors just starting out often guide their choice between growth stocks and value stocks with lessons learned from the past. Benjamin Graham and his heir apparent Warren Buffet offer advice on picking value stocks – companies worth more than their current market price.
Thomas Rowe Price is recognised as the father of growth investing, dating back to 1937. Another of history’s greats, Philip Fisher, followed in Price’s footsteps. Growth investors are willing to pay a premium share price for the potential of outstanding future growth.
Investors torn between the appeal of both investment strategies can turn to Peter Lynch, the father of Growth at a Reasonable Price (GARP) investing. For thirteen years, from 1977 to 1990 he rewarded investors in the Fidelity Magellan Fund with an astounding annual growth rate of 29.2%, crushing the return of the S&P 500 Index, making the Magellan Fund the top performing fund on the planet.
Lynch’s work led to multiple top rated books on investing, with investment principles suitable for all investors. Although it does not get the recognition of the ubiquitous value and growth investing strategies, GARP investing is itself a hybrid model, incorporating principles of both the more favored investing approaches.
GARP investor are looking for essentially the best of both worlds – stocks with solid growth potential whose current share price does not reflect that potential.
Top Australian Brokers
- eToro - Social and copy trading platform - Read our review
- IC Markets - Experienced and highly regulated - Read our review
- Avatrade - Powerful trading tools - Read our review
There is one ratio that takes a step beyond the most popular of all metrics – the venerable Price to Earnings Ratio (P/E). That ratio – the Price to Earnings Growth Ratio (P/EG) — is the sine qua non for GARP investors.
The P/E ratio, or the multiple as many analysts characterise it – essentially tells an investor how much he or she is paying for the company’s historical earnings. So a high P/E multiple – 25 or more – means the price paid is twenty five times the company’s earnings. Some financial websites provide a TTM (trailing twelve month) P/E which takes earnings between annual financial statements into account.
Value investors look for low P/E’s while the opposite is true for Growth investors. However, the P/E ratio is essentially looking in the rear view mirror, not at the road ahead.
For that, GARP investors turn to the PE/G ratio, which adds projected growth into the calculation – Price/Earnings ratio divided by Growth Rate.
Standing alone the P/E ratio can spot stocks whose historical performance points to a discount price when compared to the average sector P/E. The P/EG ratio adds the forecasted growth rate to help spot stocks with potential.
Like the P/E, the P/EG for an individual stock needs to be compared to its sector average.
Some investing experts caution that the earnings figure in the P/E can be manipulated. The P/EG suffers from the same potential drawback, but in addition the projected growth rate is a product of analyst and/or company management opinion that may or may not come to pass. In addition, not all financial websites include the P/EG in their metrics section, leaving the investor with the formidable task of calculating the ratio on their own.
GARP investors, like their value and growth counterparts, do not rely on a single metric. The P/EG is a starting point where a ratio of 1.0 indicates the stock is fairly priced. Fairly priced means the share price is in line with the company’s forecasted earnings. P/EG values below 1.0 indicate an undervalued stock, with P/EG’s under 0.5 being especially attractive targets. Low P/EG’s open the door to an investment where the price paid understates the company’s potential earnings.
GARP investors also look at historical earnings growth rates, ideally five years, as well as forecasted earnings growth. Higher P/Es are not a concern for many GARP investors if the earnings history and projected growth meet or approximate the ideal 15% for both.
As is the case with most, if not all, investing strategies, there is rarely a perfect fit. The following table includes three ASX stocks that come close.
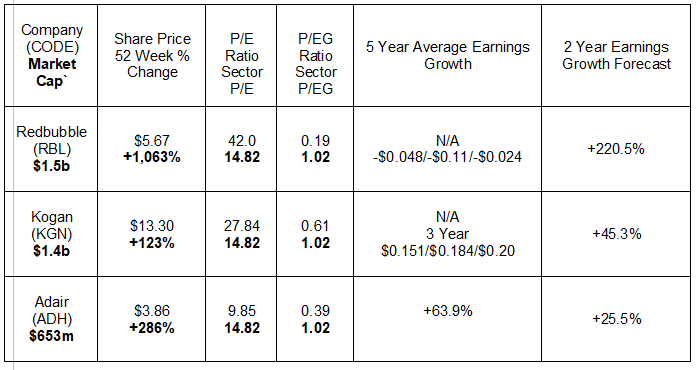
A P/E Ratio twice that of the retailing sector average along with the massive share price appreciation should serve to classify Redbubble Limited (RBL) as a growth stock. However, the ultra-low P/EG along with the impressive earnings growth forecast might tempt some GARP Investors.
The critical factor that should cause GARP proponents to pause is the abysmal earnings history over the past three years. The company has grown revenue in each of the last three years but has yet to turn a profit. Growth investors are not swayed by the lack of profitability in the short term in the belief it will come, as the massive earnings growth forecast suggests. At best, Redbubble could attract GARP investors with a high degree of risk tolerance.
The company bills itself as following the dream that led to their creation – “giving independent artists a meaningful new way to sell their creations.” For the company, the dream has led to more than “700,000 artists and designers across the planet with millions of passionate fans using Redbubble.”
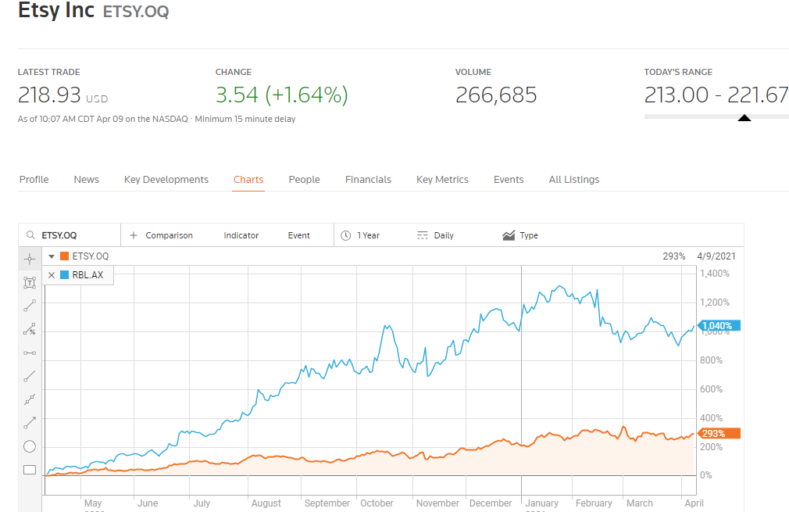
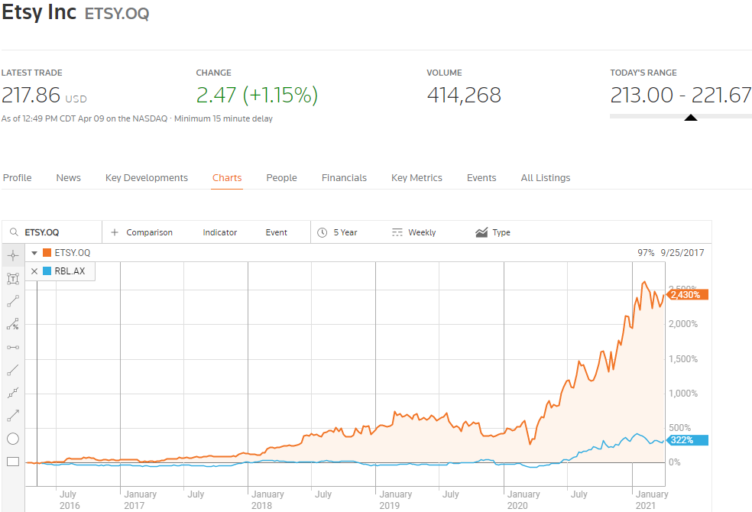
Many Aussie investors are moved by comparisons between an ASX listed company and a US counterpart. In the US, a company called Etsy has a similar dream to Redbubble’s – to provide a” global marketplace for unique and creative goods. It is home to a universe of special, extraordinary items, from unique handcrafted pieces to vintage treasures.”
A year over year share price performance comparison between Etsy and Redbubble might explain why Redbubble’s three month average trading volume stands at an impressive 2.4 million shares per day. From the Reuters website:
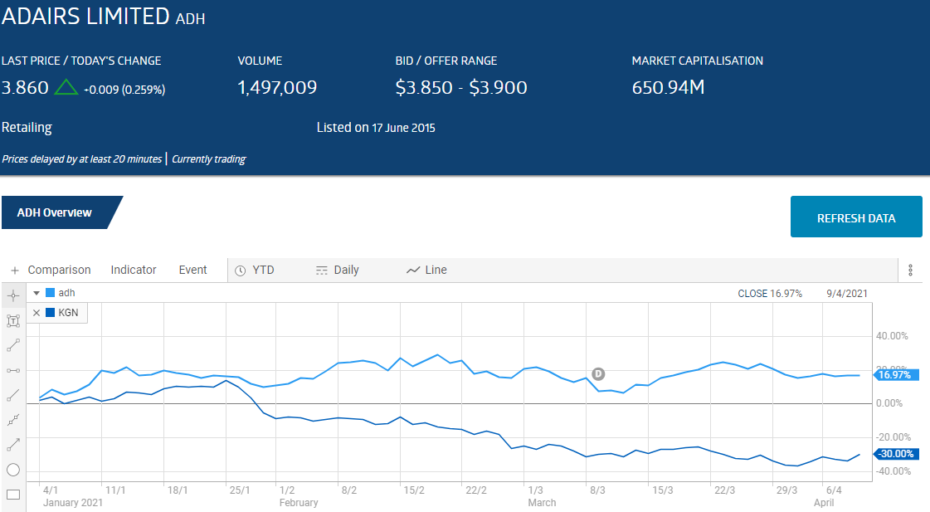
In contrast fellow Australian online retailers Kogan Limited (KGN) and Adairs Limited (ADH) have thirty day average trading volumes of 1.6 million and 1.4 million shares a day, respectively.
Etsy has increased revenues, profit, and earnings per share in each of the last five fiscal years. Over that period, its share price reflects its superior performance.
Aussie investors interested in Redbubble should know its business model is substantially different than Etsy’s, where artists can sell craft and art items of their own making. Redbubble operates on a “print on demand” model where artists upload designs of their own making with Redbubble fulfilling customer requests to print the design on a variety of products.
Kogan Limited (KGN) bills itself as “Australia’s premier online shopping destination.” The COVID 19 Pandemic gave the company a massive boost, with a Half Year 2021 increase in adjusted net profit after tax of 250.2%. Although best known for its Amazon-like array of product offerings online, Kogan operates multiple businesses, including:
- Kogan Mobile,
- Kogan Internet,
- Kogan Insurance,
- Kogan Health,
- Kogan Pet Insurance,
- Kogan Life Insurance and
- Kogan Travel.
Like Amazon, Kogan’s online retail operations includes independent marketplace sellers. In addition to the positive Half Year metrics like the 88.6% increase in revenues, Kogan reduced its operating expenses for the period by 119%. Kogan is a solid dividend payer, with increasing dividend payments in each of the last three fiscal years and a two year dividend growth forecast of +39.8%.
Adairs Limited (ADH) is a retailer with a multi-channel distribution operation. The company’s independent Mocka brand is an exclusively online distributor of a range of products from home furniture & decor to kids and baby goods.
The flagship Adairs brand operates with both brick and mortar store outlets and a growing online operation, offering home furnishings. Adairs’ online presence allowed the company to thrive in FY 2020 and into the first half of FY 2021, despite the pandemic.
Adairs has an impressive five year average earnings growth record. The company is a dividend payer, with a current yield of 4.6% and a two year dividend growth forecast of +49%. The share price hit a record high on 16 February following the release of Half Year 2021 Financials. Adairs’ store sales were up 4.6% while online sales grew 95.2% and Mocka online sales increased 44.4%. Net profit after tax (NPAT) rose 233.4% and earnings per share (EPS) went up 227.3%.
The good news for the company continued, with the results announcement including online sales results for the first seven works of the second half of FY 2021 – Adairs’ online sales up 65.9% and Mocka sales up 48.6%.
Year to date Adairs’ share price remains in positive territory while Kogan’s has been dragged down by the tech rout in the US. Kogan prides itself on its technology.
From the ASX website: