Social media platforms have played a major role in attracting the flood of new investors to share markets over the past year. Seasoned market experts have expressed concern many of these new investors lack the know-how to perform their own “due diligence” on a potential stock to pick to start or add to their investment portfolio.
Somewhere in the past some market commentator got the idea to adopt the term “due diligence” from its original use as a means of assessing major real estate purchases or company acquisitions. Now due diligence has entered the world of share market investing. Retail investors are encouraged to exact their own potential stock investments to a due diligence process.
Given the fact formal due diligence of a potential acquisition target is performed by highly skilled professionals, including lawyers, accountants, and financial analysts, it is not hard to understand why many of today’s newcomers rely on social media platforms for due diligence.
There they find “hot” stock tips and advice from peers who appear highly knowledgeable.
This is not due diligence. Investors old and new who have researched the level of complexity and detail that goes into a rigorous due diligence process for a corporate acquisition have simpler tools for their own use.
Top Australian Brokers
- eToro - Social and copy trading platform - Read our review
- IC Markets - Experienced and highly regulated - Read our review
- Avatrade - Powerful trading tools - Read our review
The internet is filled with definitions of “due diligence” with some variance in what they include.
Here is one from the website wikifinancepedia.com/e-learning/definition:
- Investment due diligence refer to a process of extensive and intensive research to evaluate an investment decision, considering all possibilities and verifying the information used.
The website Investopedia.com offers a simpler definition, adding some specifics about research subjects:
- Due Diligence is defined as an investigation of a potential investment (such as a stock) or product to confirm all facts. These facts can include such items as reviewing all financial records, past company performance, plus anything else deemed material. For individual investors, doing due diligence on a potential stock investment is voluntary, but recommended.
Newer and some more seasoned investors might balk at this kind of due diligence once they see what it takes to “review all financial records and past company performance.” This suggests significant investments of time to search and study financial and performance history and to identify “anything else seemed material.”
Many investors who do attempt simplified due diligence gravitate towards financial ratios, often focusing exclusively on valuation ratios, like the favored Price to Earnings Ratio (P/E).
Financial ratios are the principal tools investors have to simplify their due diligence, since the ratios are readily available on many financial websites, eliminating the need for a retail investor to scour company financial statements for needed information.
For example, the share price of a potential investment taken alone is relatively meaningless. When combined with the company’s earnings performance by dividing the share price by the earnings per share (EPS) investors have a useful measure. The P/E tells an investor how much he or she is paying for the company’s earnings performance, with high P/E’s pointing to a premium price and low P/E’s pointing to a bargain price.
Too many investors stop with the P/E alone while sometimes also looking at some other price derived ratios such as Price to Sales (P/S), Price to Book (P/B), and Price to Earnings Growth (PEG). These price ratios represent only one category of financial ratios available for investors to do their due diligence.
There is some variance in the listing of categories across financial websites, but here are the most frequently cited:
- Liquidity ratios
- Leverage ratios
- Efficiency ratios
- Profitability ratios
- Market value ratios
Note that in this list the valuation ratios are listed last. The reason is they all use the current share price of the stock as the numerator in the ratio and the price often has little to do with the fundamentals of the company. In truth, price ratios reflect market sentiment about the stock. Higher price ratios indicate the market’s belief about the positive future of the company while lower ratios indicate the opposite.
The first four categories touch on fundamental issues within the company, including financial soundness and effective performance. Some ratios are less applicable to certain industries. Investopedia has an article on financial ratios for the mining industry that recommends only three.
LIQUIDITY and LEVERAGE RATIOS
Liquidity and leverage ratios assess a company’s ability to handle its debt.
The Current Ratio and the Quick Ratio tell investors if the company has sufficient cash to handle its short term debt. The Current Ratio is current assets divided by current liabilities, with ratios over 1 indicating the company can handle its 12 month debt obligations. The Quick Ratio is preferred by some since it only includes liquid assets that can be liquidated in the time frame needed.
Leverage ratios measure a company’s ability to handle its long-term debt. The Debt to Equity Ratio compares the company’s long term debt to its equity (capital supplied by investors) with lower ratios indicating lower risk. Ratios approaching 100% are considered risky.
Interest-coverage ratios show how well a company can handle the interest payments on its debts.
EFFICIENCY and PROFITABILITY RATIOS
Efficiency Ratios assess how well the company uses its resources, such as assets available, to generate sales. Ratios measure how efficient a company is at “turning over” its inventory, receivables, payables, and assets.
Profitability Ratios measure a company’s profit generation at various points of operations, including gross and operating margins and net profit margins. Return on Equity and Return on Assets tell an investor how well the company is turning its shareholder equity and assets into profit.
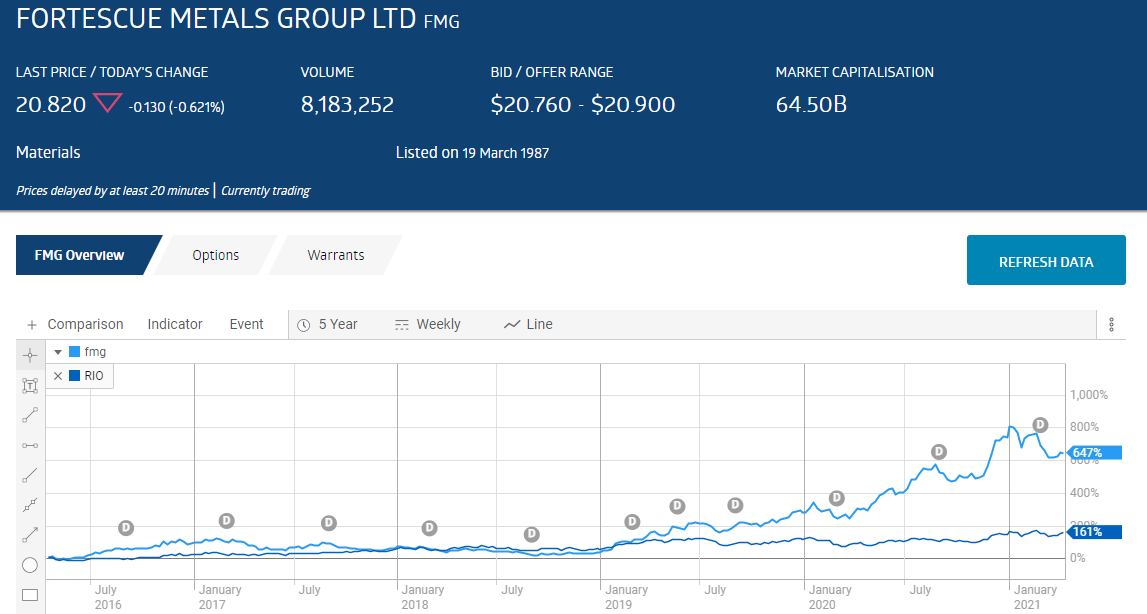
The following table lists select ratios from the first four categories for two of Australia’s top iron ore mining companies – Rio Tinto Limited (RIO) and Fortescue Metals (FMG).
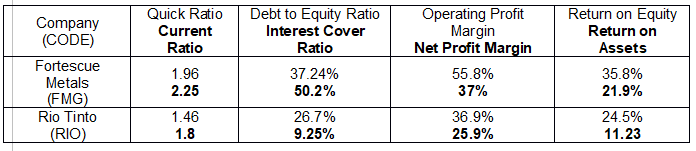
The liquidity and leverage ratios indicate both companies are financially sound, with relatively low debt and the ability to manage the debt both short and long term.
The efficiency and profitability ratios tell investors both companies have impressive profit margins and are making efficient use of both investor capital and assets available.
In a perfect world investors would be able to make “apples to apples” comparisons between potential investments. The market is far from perfect, but investors still need to find comparison measures to make better buy and sell decisions.
Fortescue is a “pure play” iron ore miner while Rio is diversified, although iron ore remains its principal source of revenue. Based on those similarities the comparisons have some validity.
Time is another source of comparison. Individual ratios like the ones above represent a point in time and with some time spent searching, investors can find financial websites that show how profit margins and returns on assets and equity have fared over time.
Although numbers do not tell the whole story needed for more thorough due diligence, starting with numbers indicative of how the company operates seems a better taking off point than starting with valuation ratios.
The last table compares valuation measures for the two companies and the materials sector in which they operate where possible. These ratios could more appropriately be called “market” ratios since they reflect what market participants think about the company as opposed to measures of actual historical company performance.
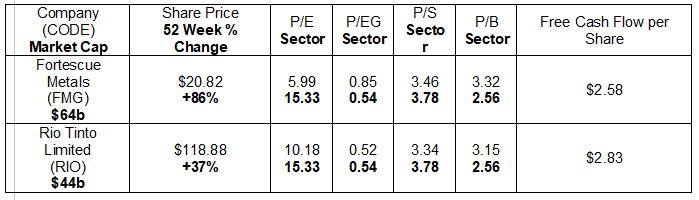
Both companies have attractive P/E ratios and year over year share price performance, although Fortescue has substantially outperformed Rio. The P/EG values, which take future growth into account in their calculation, are in line with the sector average as are the Price to Sales ratios
The Free Cash Flow per Share measure is not found on many financial websites. Given the difficulty in finding this figure it comes as no surprise few investors consider it. However, it is a tool highly valued by analysts as it indicates a company’s ability to generate additional revenue. Free cash flow is capital available to the company after operating expenditures, asset acquisitions, and asset sales have been accounted for. Free Cash Flow to a corporation is like discretionary income to a consumer.
Close to $3.00 per share sounds good, especially for Fortescue given its larger market capitalisation. Digging deeper to compare those numbers with BHP Group (BHP), a diversified resource company and a major iron ore producer, makes the numbers look better. BHP’s free cash flow per share is $1.14.
For investors with the time and temperament there is much more to the due diligence process beyond the basic numbers outlined above. Dividend yield is one, with both companies currently featuring high yields and consistent dividend payments over the last five years.