
Getting the Best Price on a Stock Using Market Depth
In today’s digital age, many retail investors avoid placing buy or sell orders for stocks directly through a full-service brokerage house, choosing instead to place their trades through one of the available online trading platforms littering the share market.
Some long-term investors unconcerned with getting the best price for a transaction will place an “at market” order buying or selling at market price when their order comes up in the queue.
Other investors who want a more precise price for their orders need to know the supply/demand situation for their trade in real time, preferring limit orders for a specific price over market orders placed at the market price at the time of execution. These investors need access to Market Depth information.
Top Australian Brokers
- Pepperstone - Trading education - Read our review
- IC Markets - Experienced and highly regulated - Read our review
- eToro - Social and copy trading platform - Read our review
What is Market Depth
Market Depth information is available on most of the better trading platforms, included with the service or offered with a premium subscription.
The direction a share price takes at any given moment depends on the supply and demand for the stock. When supply is high with sellers ready to sell, the stock price will fall as sellers compete for fewer buyers,
When the demand is high with more buyers than sellers, the price of the stock will rise as buyers compete for the limited supply of sellers.
To get the best price investors need access to buy and sell orders in real time to assess the supply/demand situation. In essence, market depth shows the liquidity for a given stock based on standing buy and sell orders awaiting execution.
Market depth information goes beyond bid and ask price levels, including the size of the order at each price level. Order size can impact a stock’s price, with high volume orders an indication of high demand for the stock, driving up the price. Low volume orders reflect low demand for the stock, generally driving down the price as sellers become willing to lower their asking price.
Market Depth information is referred to as Level 2 Market Data, differentiating it from Level 1 Market Data which typically is limited to bid and ask spreads and order volume for each order as they come up in the order book queue. Level 2 market data is favored by short-term traders and long term traders looking for a specific buy or sell price as Level 2 includes all outstanding orders for a given stock, not just those in the real-time order queue.
Incorporating Market Depth in Your Trading
The first challenge in incorporating market depth in your trading is selecting a trading platform that best fids your investing style and level of experience.
Some free market depth charging offerings report on a “market delay” timing, not in real time. Make sure your platform uses real time data, with tutorials for understanding the chart desirable, if not essential.
There are dedicated technical analysis software sites that offer market depth information with a subscription fee, such as kb.bullcharts.com.au. The following market depth chart for BHP is from that website:
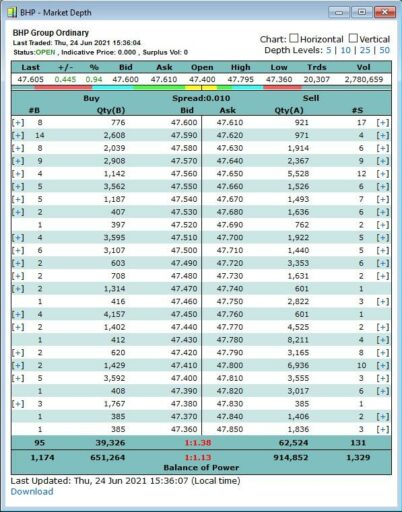
Source: kb.bullcharts.com.au/knowledge-base/market-depth-screen-how-to-understand-it
You cannot buy and sell stocks from this website but the platform’s market depth chart can serve as a model against which to compare charting available on a trading platform.
On the left side of the chart you see the bids from buyers along with the quantity desired (Qty B) and the number of buyers (B). On the right side you see the number of sellers (S) and the quantity of shares for sale at the asking price (QTY A).
At the top of the chart you see the date, time, and price of the last trade, the current bid and ask and the spread between what the buyers are willing to pay and the price at which sellers are willing to sell. You also see the high and low price of the stock in the trading day to that point
The dance between buyers and sellers Is essentially an auction, with each side waiting for the other side to budge. When a buyer raises the bid or a seller lowers the ask, the trade is executed, with the next line moving to the top.
In the example chart, note the bids are increasing from the bottom of the list to the top while the asks are decreasing from the bottom to the top as buyers and sellers come closer to a deal with the spread decreasing.
The balance of power calculation appearing on this chart shows overall, there are more sellers than buyers, calculated by dividing the larger number of sellers (1329) by the smaller number of buyers (1174).
The market depth chart shows an investor the price points at which he or she can buy or sell the quantity of the stock. When the balance of power favors sellers, the potential buyer will need to increase the bid price. When buyers outnumber sellers, the seller can wait until the asking price is met.
Liquidity is important to both short-term traders and long-term investors, and tracking the market depth chart during trading hours clearly shows how liquid a stock is.
Both traders and investors can see buying and selling pressure and enter or exit trades accordingly. There are some experienced investors who claim a market depth chart can help spot support and resistance levels by spotting price levels above which a stock will not go – resistance – and levels below which a stock price will not fall – support.
Can Market Depth Predict a Stock’s Opening Price
The ASX has a Pre-Open period during which time orders can be entered but executing trades must wait for the market to open. While theoretically possible to predict the opening price based on pre-opening orders, the ASX has algorithmic rules for establishing opening prices involving rules and conditions applied in multiple steps only when pre-opening prices overlap – all buy orders are lower than all sell orders.
Dedicated technical analysis software charting websites and many online trading platforms offer Aussie investors market data to facilitate trading strategies. Dedicated technical analysis sites do not have the capacity to place trades and require subscription fees. Some online trading platforms require premium level subscriptions for access to market data, of level 2 data.
A market data chart for a particular stock lists all existing limit orders for the stock, with the number of buyers and sellers, the amount of stock available, and the price points at which buyers and sellers are willing to accept. The difference between a buyers bid price and a sellers ask price is called the spread.
The information can tell investors the stock’s liquidity, and whether the buyers outnumber sellers, creating buying pressure, or whether sellers outnumber buyers, creating selling pressure.
Market data can show investors the price points at which they can buy or sell shares in their desired quantity.