
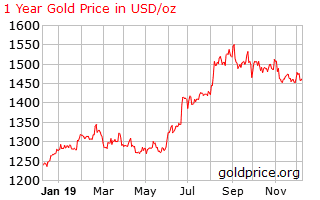
In September of 2018 clouds darkened the horizon of global economic growth with a seemingly never-ending US/China trade war and lowering growth forecasts from economists around the world. On cue, the price of gold rallied, as it generally does in uncertain times. Uncertainty was the watchword as economic indicators bounced back and forth with some seeing ominous signs and others with the belief “this too shall pass.”
By September of 2019 the outlook was changing with the yield on US Treasury bonds increasing, the outlook for a resolution to the US/China trade impasse improving, and a US stock market that stubbornly refused to stay down for more than a few days. On the morning of 13 December in the US, a preliminary trade deal between the US and China was announced.
In early November the Bank of America Merrill Lynch Global Fund Manager Survey indicated the optimistic outlook on global growth was rising at its fastest rate in 20 years.
Investors eager to cash in on US equities continuing to post new all-time highs abandoned safe havens and jumped in feet first, fearing being left behind.
Predictably, gold prices began to fall.
Top Australian Brokers
- Pepperstone - Trading education - Read our review
- IC Markets - Experienced and highly regulated - Read our review
- eToro - Social and copy trading platform - Read our review
Gold “bugs” have four ways to get in on the act, should they choose to see the downturn as a buying opportunity rather than as a foreboding sign of darker days on the horizon for gold.
The first is to buy physical gold from online dealers, not to be stored under your bed, but held by the dealer in an account.
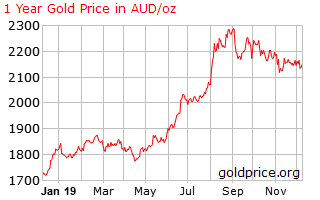
The second method is to buy an ETF (Exchange Traded Fund) that buys and stores gold bullion. Australian Investors can invest in GOLD.AX, ETFS Physical Gold. Aussie investors get a bit of a bump from the exchange rate when compared with the US ETF – SPDR Gold Trust (GLD).
The third is another ETF, this one for gold miners. VanEck Vectors Gold Miners (GDX) is the ETF of choice globally. The GDX tracks the share price performance of global gold miners, with the same disadvantage common to all equity ETFs. An investor’s return is an average of the miners in the fund, with the returns from high performing miners getting dragged down by lower performing miners.
This leads us to the fourth method, and arguably the riskiest when compared to an ETF – individual stock picking. The logic behind picking best of breed gold miners on the ASX is indisputable. Finding them is another matter entirely, especially given the seductive lure of junior miners for many Aussie retail investors.
During the glory days of the iron ore boom start-up junior miners with attractive resource finds fueled the dreams of many an investor seeking the big score. This penchant had the backing of one of history’s greatest investors – Peter Lynch. His comment that “big companies don’t make big moves” fueled the speculative fires surrounding the juniors, in a search for Lynch’s fabled “ten-bagger.”
There is no shortage of gold miners on the ASX from which to choose, but two stand above the rest by a wide margin based on both historical performance and future growth.
Northern Star Resources (NST) and Evolution Mining (EVN) vaulted into the top tier of Australian gold miners through key acquisitions of the assets of major international players looking to improve their balance sheets in the early days of the collapse of the mining boom.
There are other miners worthy of consideration, based on dividend or earnings growth or both. Skeptics fearful of buying any of these miners on the current dip might want to consider their historical share price performance along with the benefit of operating costs incurred in Australian dollars with revenues collected in US dollars.
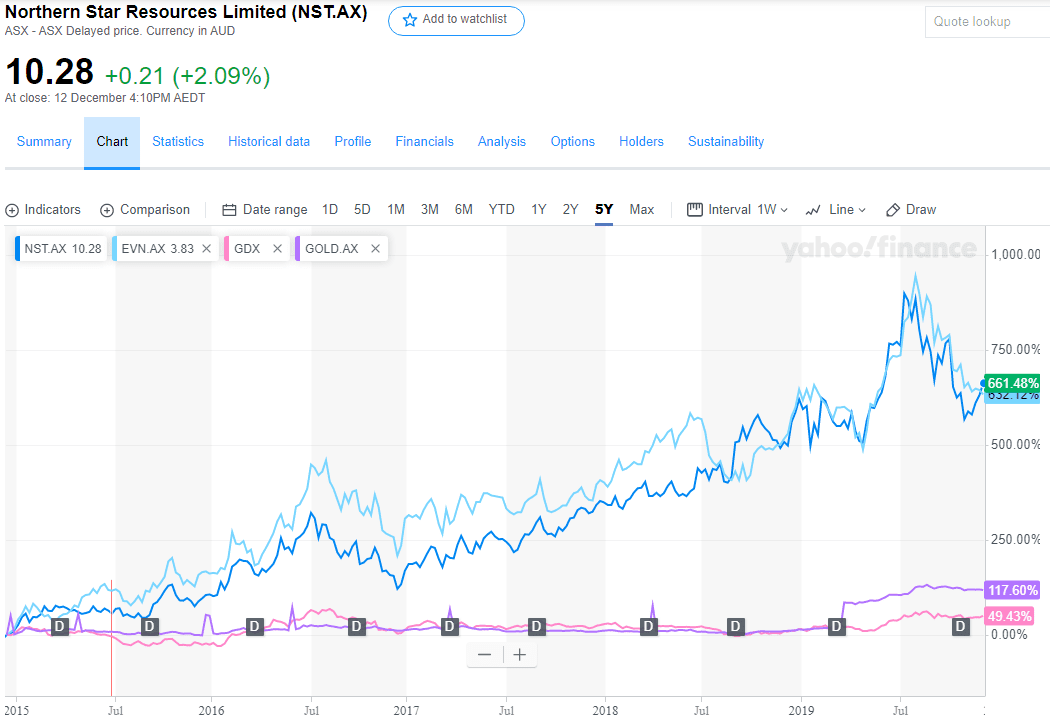
For die hard skeptics needing more evidence we offer this comparison of the price movement of the two best performing ASX gold miners against the ASX GOLD ETF and the US GDX gold miner ETF.
Some investors are jumping in as the three-month downturn appears easing. Why not you?
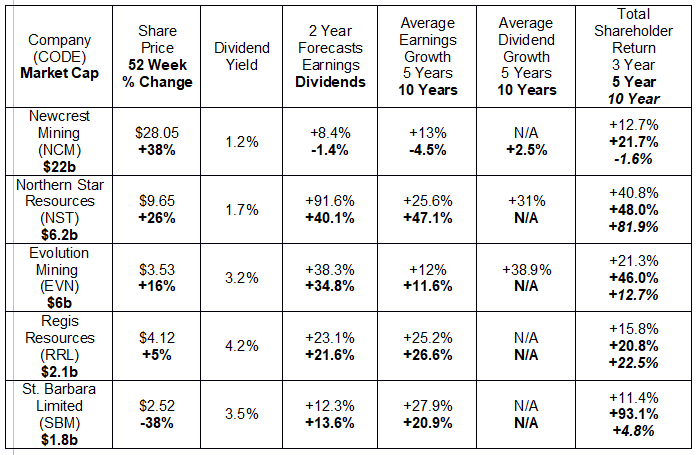
Newcrest Mining (NCM) is Australia’s largest gold miner and one of only two ASX entries in the Top Ten Global Gold Miners list – the other being South-African based AngloGold Ashanti Limited (AGG).
However, one does not have to be a Certified Financial Analyst (CFA) to look at our table and see Newcrest, based on historical performance in total shareholder return, may not be the top choice of many investors. Many mega-miners in the glory days rushed to increase their asset base regardless of cost in some cases, while at the same time ignoring cost controls. Why worry about costs when commodity prices are soaring? Newcrest was among many forced to sell unproductive assets, to the benefit of companies like Northern Star and Evolution who bought them.
Northern Star began is meteoric rise to prominence when it acquired Western Australia’s Paulsen’s Gold Mine from Intrepid Mines. Subsequent acquisitions propelled the company from its 2010 production of 100,000oz per year from one mine to its FY2020 production from three mining centres of 800,000-900,000oz.
The company’s latest acquisition came in 2018 when Northern Star expanded its reach into North America with the purchase of the Pogo Gold Mine in the US state of Alaska from rom Sumitomo Metal Mining Co., Ltd. Northern Star also has additional exploration assets in Western Australia and the Northern Territory.
The Pogo operation has disappointed investors and analysts alike, with one analyst predicting a turnaround may not come until after FY 2020. Some brokers remain optimistic, with UBS the latest to upgrade NST from NEUTRAL to BUY with a $12.00 price target, following another upgrade at JP Morgan from NEUTRAL to OVERWEIGHT.
Evolution Mining has six producing gold and silver operations in Western Australia and in Queensland, all 100% owned by the company. On 26 November Evolution announced its expansion into North America with the purchase of the Red Lake gold complex in western Ontario, Canada from Newmont Goldcorp Corporation.
Like Northern Star, Evolution grabbed the opportunity to acquire assets from offshore operators looking to shed exploration assets to improve their balance sheets.
Evolution’s Full Year 2019 financial results were a disappointment to investors, with revenues declining from $1.54 billion to $1.509 billion, and profit slipping from $263 million to $218 million. Northern Star also saw its FY 2019 profit fall from $194 million to $157 million but revenues increased from $964 million to $1.4 billion, with the company attributing the increase to the Pogo operation.
Evolution has a significant cost advantage over rival Northern Star with All in Sustaining Costs (ASIC) of AUD$924 per ounce, earning the company the number two spot of the lowest cost producers in the GDX. Northern Star’s ASIC reported in the FY 2019 financial results was between AUD$1,200-AUD$1,300/oz.
The company has an aggressive growth strategy in place, with the 2019 results announcement highlighting “three earlier stage joint ventures and a number of others in the pipeline.” Evolution plans to come close to doubling its FY 2019 discovery budget, devoting between AUD$80 million and $105 million in FY 2020. Evolution has the best dividend payment history of any of the shares in our table.
Few investors think of gold miners when the time comes to think about investing in dividend paying stocks, yet both Evolution and Northern Star have been increasing dividend payments for the past five years. Regis Resources and St. Barbara have higher current yields but lack a historical track record.
Regis has three operating gold mines in Western Australia and a development project in New South Wales, acquired from Newmont in 2012. The project, the McPhillamys Gold Project, was in the exploratory drilling phase when Regis assumed ownership. A DFS (definitive feasibility study) is complete and the company awaits final regulatory approvals.
Although FY 2019 profit at Regis fell slightly to $163 million, down from FY 2018 profit of $174, million, revenues rose from $604 million to $654 million and the company posted record high gold production.
Some investors cling to analyst concerns about “over-valued” stocks, ignoring the maxim to “Buy High and Sell Higher” embraced by high growth enthusiasts. Regis, in the eyes of some analyst, is attractive due to its low P/E Ratio, currently around 10.45 compared with the Materials Sector average P/E of 14.41. Northern Star’s P/E is 20.94 and Evolution’s is 19.05.
Value investors would favor Regis and rival St. Barbara Limited with an even lower P/E of 8.90. Growth investors would ignore the P/E’s and focus on the growth metrics favoring both Northern Star and Evolution.
St. Barbara has gold mining operations in Western Australia and Papua New Guinea. In July 2019 the company expanded into North America, acquiring the operations of the Atlantic Gold Corporation in Nova Scotia, Canada.
St. Barbara’s recent quarterly report contained some bad news for investors and some good news. The company downgraded production guidance for its Australian operations from the previous 200,000 to 210,000 ounces to between 175,000 and 190,000 ounces with relatively high AISC (All-In Sustaining Costs) revised upward from AUD$1,230 to AUD$1,290 per ounce to between AUD$1,390 and AUD$1,450 per ounce.
The good news was positive initial guidance on the company’s newly acquired Canadian operations. Production guidance for Atlantic Gold is between 95,000 and 105,000 ounces, with a low ASIC between AUD$900 and AUD$955 per ounce.
Another stock of interest, Saracen Minerals (SAR), did not make our table since they do not yet pay dividends. The company is a low-cost producer with two mining operations in Western Australia. Saracen is following the pattern of the other successful gold miners in our table and will begin paying dividends in FY 2020. The announcement came with the positive FY 2019 financial results posting revenue increases from FY 2018’s $511 million to $555.6 million and profit rising from $$75.6 million to $92.5 million. The company’s two-year earnings growth forecast is +64.1%.