
Regardless of economic status, country of origin, or political leanings, investors the world over share one thing in common – making money. The pathway to that goal varies in numerous ways, with time being a critical determinant of the path chosen. How long is an investor willing to wait to see a return on the investment?
Broadly speaking, stocks can be categorised as either growth stocks or value stocks. Value stocks are companies whose share price trails the value of the company. These are for the patient investor, with both the time and the will to wait for profit on their investment when the stock price begins to reflect the true value of the company.
Growth stocks are for the impatient, willing to take higher risks to get faster returns. While all stocks are expected to grow over time, true growth stocks are those whose revenues, earnings, and profit are expected to grow at a more rapid pace than other stocks in their business sector or within the wider market of the ASX.
Expectations are what make growth stocks riskier than value stocks. Investors flock to stocks with high price-to-earnings ratios – a generally accepted measure of growth in stocks – firm in their belief lofty expectations will be realised. The decline in share price can be severe when expectations are not met or significantly delayed.
Right now, market participants seem fearful of delayed expectations due to economic uncertainties, leaving many formerly pricey growth stocks available at substantially reduced prices.
Top Australian Brokers
- Pepperstone - Trading education - Read our review
- IC Markets - Experienced and highly regulated - Read our review
- eToro - Social and copy trading platform - Read our review
Here are some of the best available.
- Kogan.com (ASX: KGN)
- Temple and Webster Group (ASX: TPW)
- Nanosonics (ASX: NAN)
- Arcadium Lithium (ASX: LTM)
- Airtasker (ASX: ART)
Kogan.com (ASX: KGN)
Kogan began to slide off its once market darling status following the massive increase in online sales during the COVID-19 pandemic. Australian online sales in 2021 reached $49 billion dollars, up from $38 billion in 2020. Kogan ranks in the lower half of the Top Ten Australian E-commerce sites.
Kogan was listed on the ASX in 2006 as the only company in Australia operating solely online. Kogan offers a dizzying array of goods such as electronics, furnishings, workplace needs and youth needs.
Investors quickly fell in love with Kogan shares, with the romance building until the peak of the pandemic. Despite the ensuing sell off, the Kogan share price is still up 210% since listing.
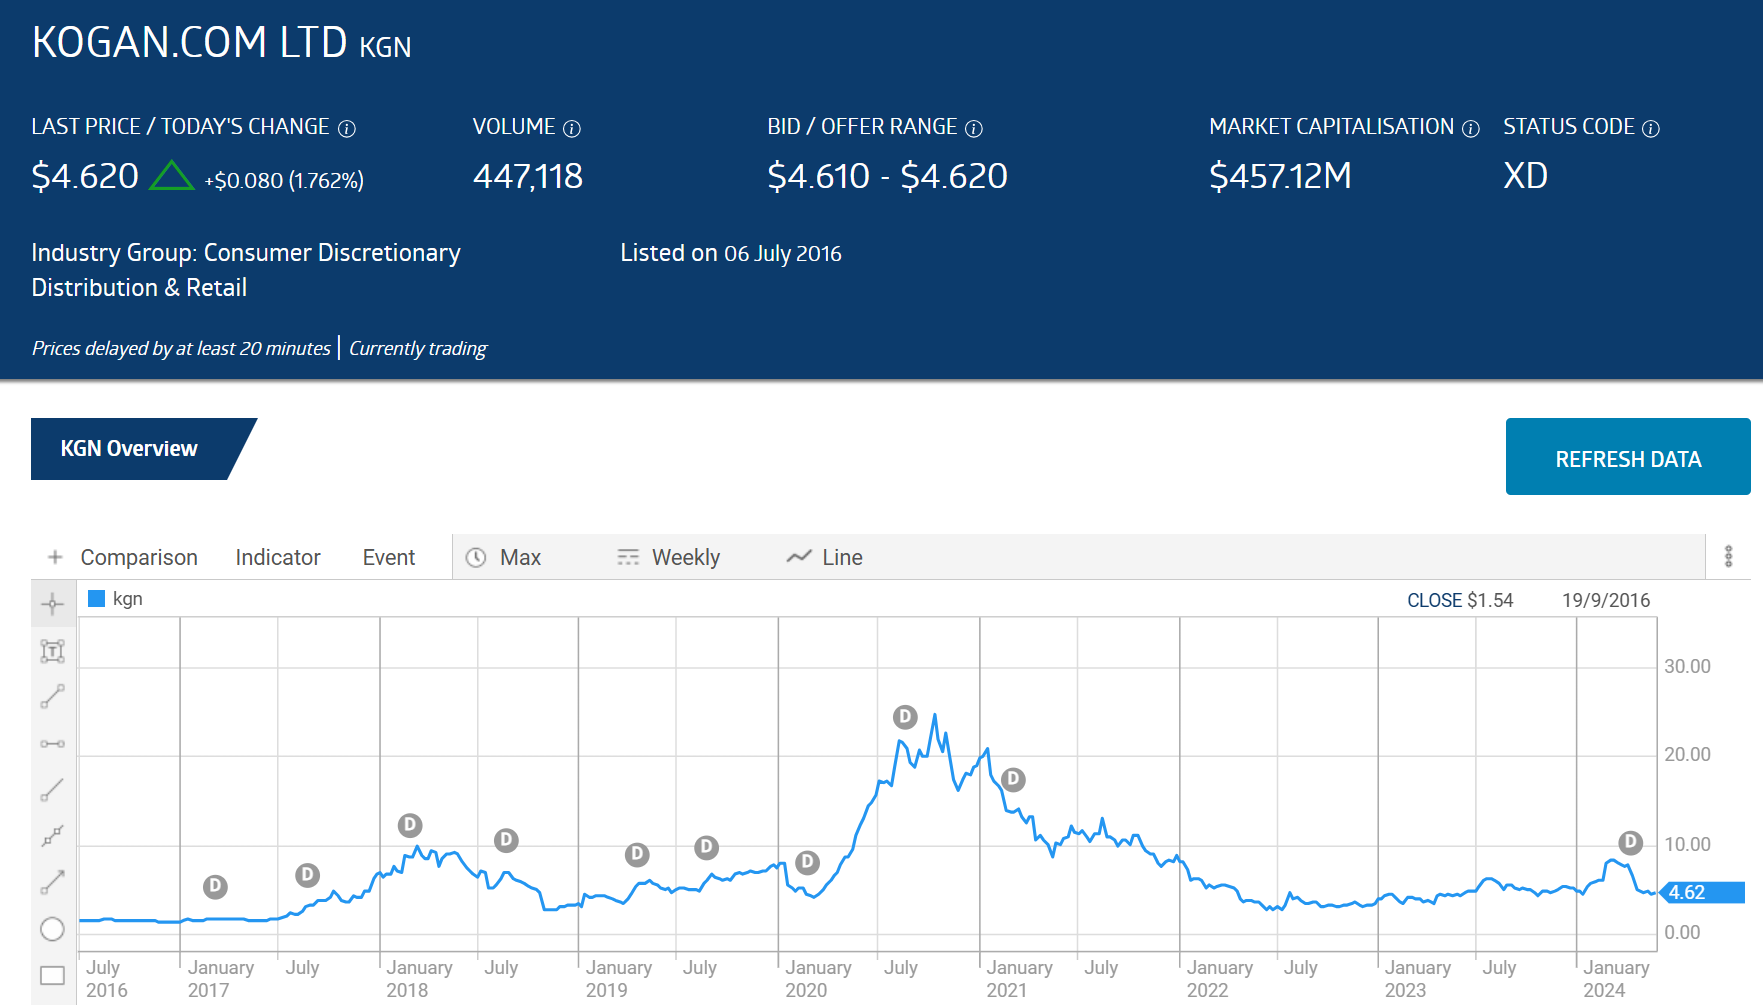
Source: ASX 27 May 2024
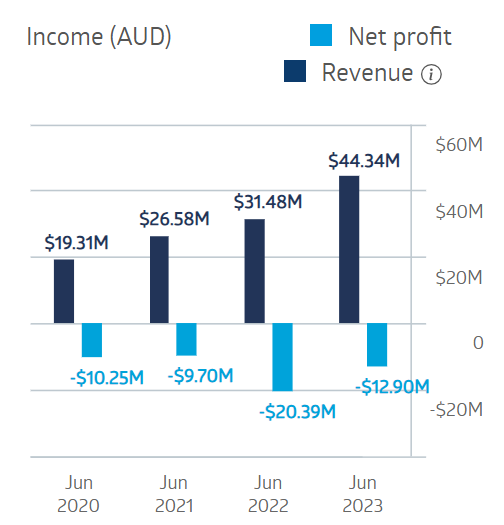
Kogan and other online retailers assumed the sales boom would last as the impact of the pandemic subsided. When the retail outlets opened their doors, consumers tired of staying at home chose the brick-and-mortar outlets in large numbers. In addition, Kogan management went on a buying spree, increasing inventory to meet demand that did not come. Supply chain disruptions contributed to the problem as well, with the company filling warehouses again to meet demand that did not materialize. The company’s profit suffered in FY 2021, cratering to losses in both FY 2022 and FY 2023.
Kogan.com Financials
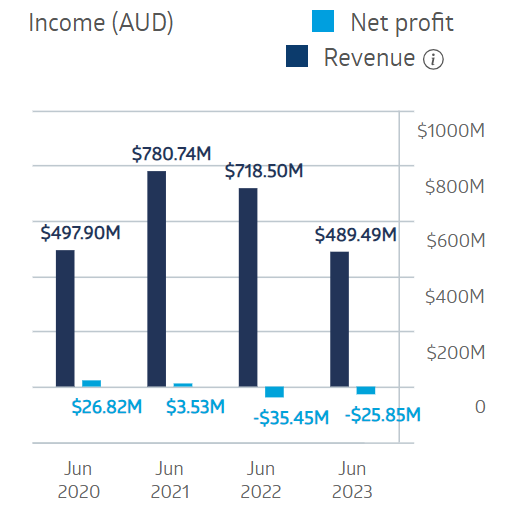
Source: ASX 27 May 2024
Half Year 2024 results had mixed news, with revenues dropping 9.9% while adjusted net profit rose 206%, posting a profit of $10.2 million dollars following a loss of $9.6 million in the first half of FY 2023.
The share price rose on the positive news but the upward movement evaporated when the company released its third quarter update, with a 6.2% drop in gross sales along with a 2.4% decline in total revenues. Management touted its transformantion to a “platform based sales” business model and the Kogan First membership as the driving factors behind the 13.8% rise in gross profit. Investors weren’t impressed.
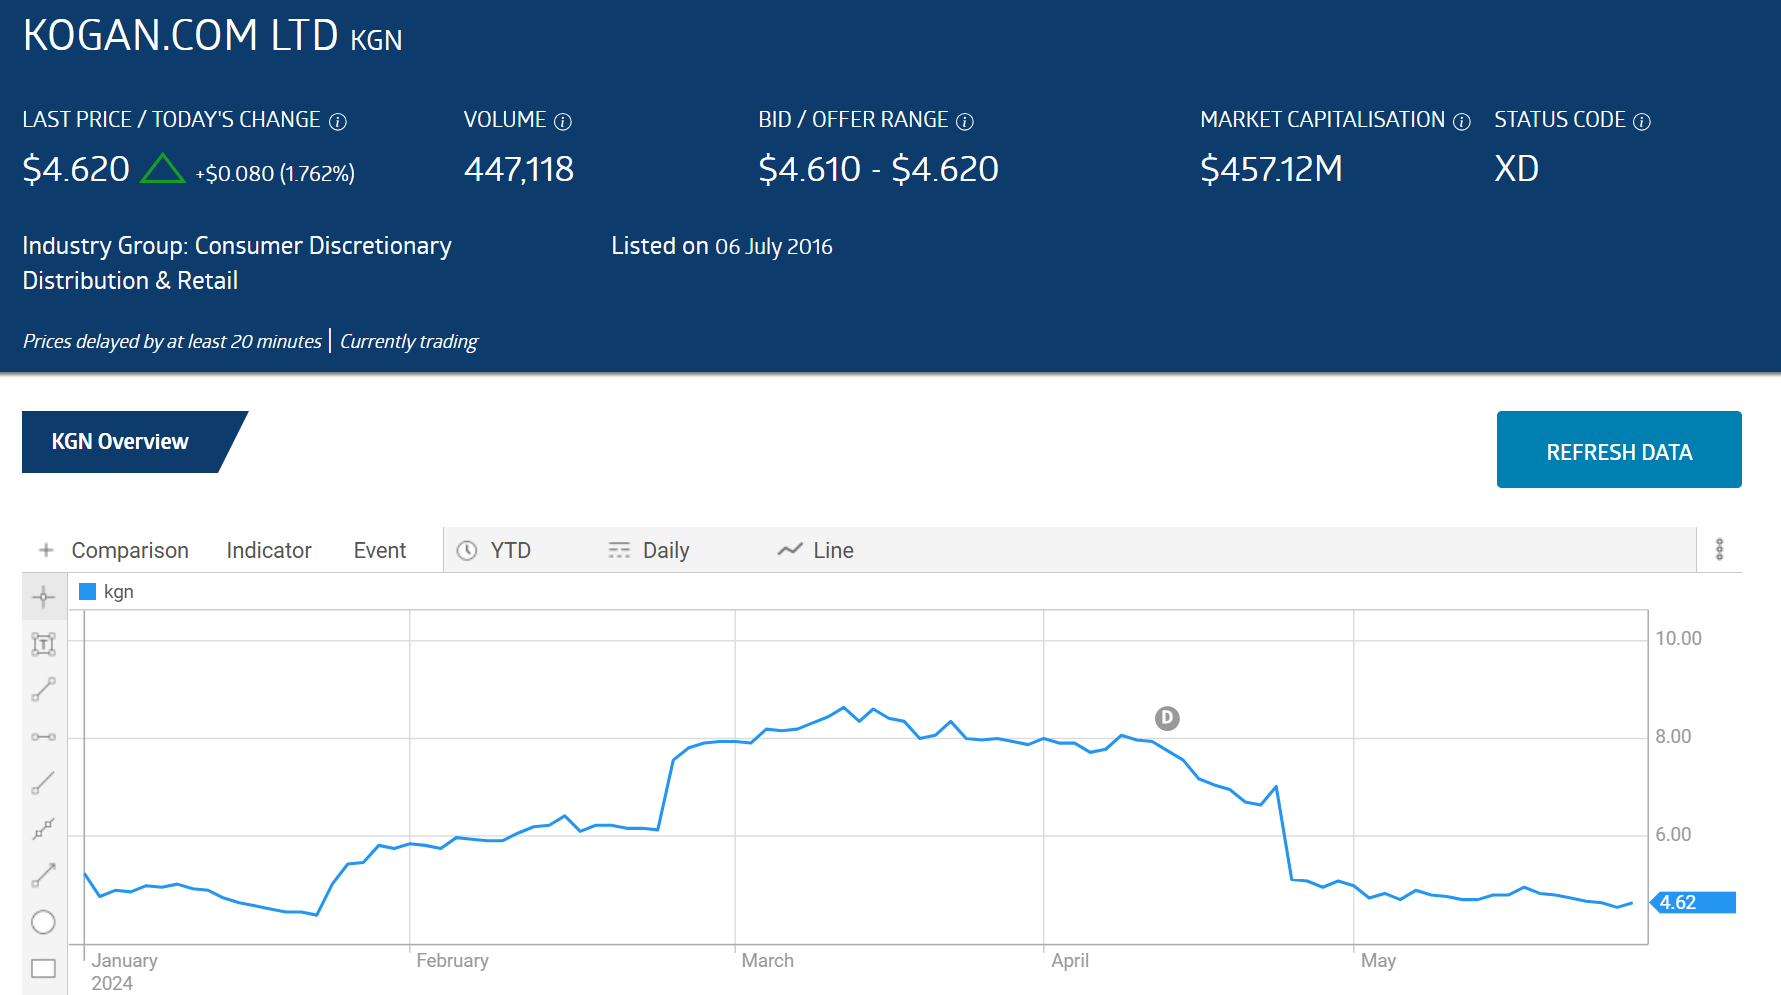
Source: ASX 27 May 2024
Kogan’s high P/E (price to earnings ratio) of 77 and price to forward earnings ratio of 40.86 still place the company in the category of a growth stock.
The 2021 eCommerce Industry Report from Australia Post found 19% of total retail trade comes from online sales. Kogan has room to further penetrate that market, although competition from Amazon Australia is formidable. Kogan can continue expanding through acquisition, as the company did with Mighty Ape. The company also operates numerous ancillary businesses in sectors such as insurance, travel, mobile, internet and others.
The Wall Street Journal has a HOLD rating on Kogan shares, with two analysts at BUY, one at OVERWEIGHT, three at HOLD, one at UNDERPERFORM, and one at SELL.
Temple and Webster Group (ASX: TPW)
The company offers furniture and homewares online, listing on the ASX in 2015 with the wind in its sails, following earning the title of Fastest Growing Internet Retailer in 2015 from Deloitte Tech.
Since listing, the share price movement was explosive at times before beginning a decline in early 2021 crashing in 2022 before a sustained upward trend began in 2023 and into 2024.
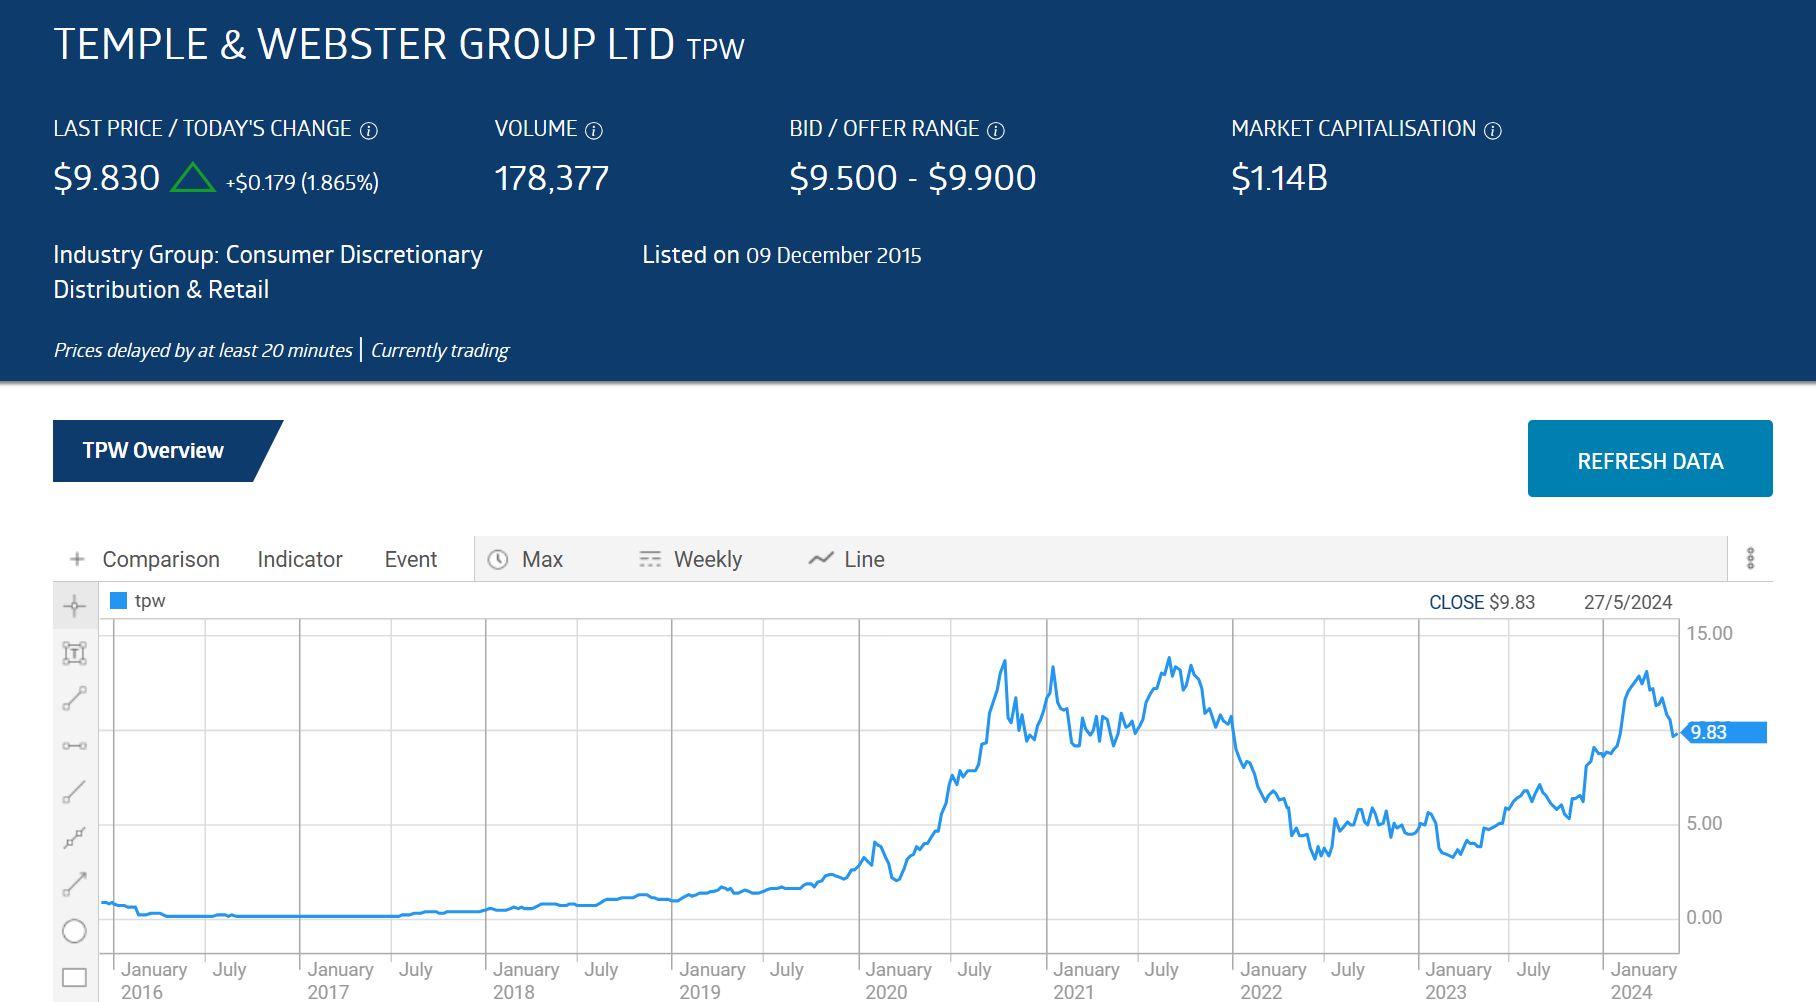
Source: ASX 27 May 2024
The share price is up more than 1000% in less than a decade. Over five years the share price is up 492% and 106% year over year.
The company has a business model that gives it a competitive advantage. Temple and Webster offer more than 200,000 products available for direct shipment to customers from the manufacturer. Temple and Webster has no need for warehousing or costly inventory management. Temple also offers private-label brands from overseas suppliers.
The 2021 share price decline cannot be attributed to excess inventory, but supply chain issues impacting its suppliers could have played a role.
Despite this, the company managed to grow revenue in each of the last four years while maintaining profitability with declines in FY 2022 and FY 2023 during inflationary times coupled with questionable consumer spending
Temple and Webster Financials
Source: ASX 27 May 2024
Half Year 2024 results showed a 23% revenue increase with the $254 million dollars in revenue setting a company record. Net profit after tax climbed slightly, from $3.9 million dollars to $4.1 million dollars.
The company is operating on a new “platform sales” strategy, targeting one billion dollars in sales within three to five years aided by the company’s internal AI (artificial intelligence) solutions.
The company’s current P/E is 144.35, while the forward P/E is 146.2, characteristic of high growth stocks.
While investors may be adopting a bearish view of the stock, driving down the share price 21% over the last three months, the analyst community remains bullish.
The Wall Street journal is reporting an OVERWEIGHT rating on TPW shares, with seven analysts at BUY and four at HOLD.
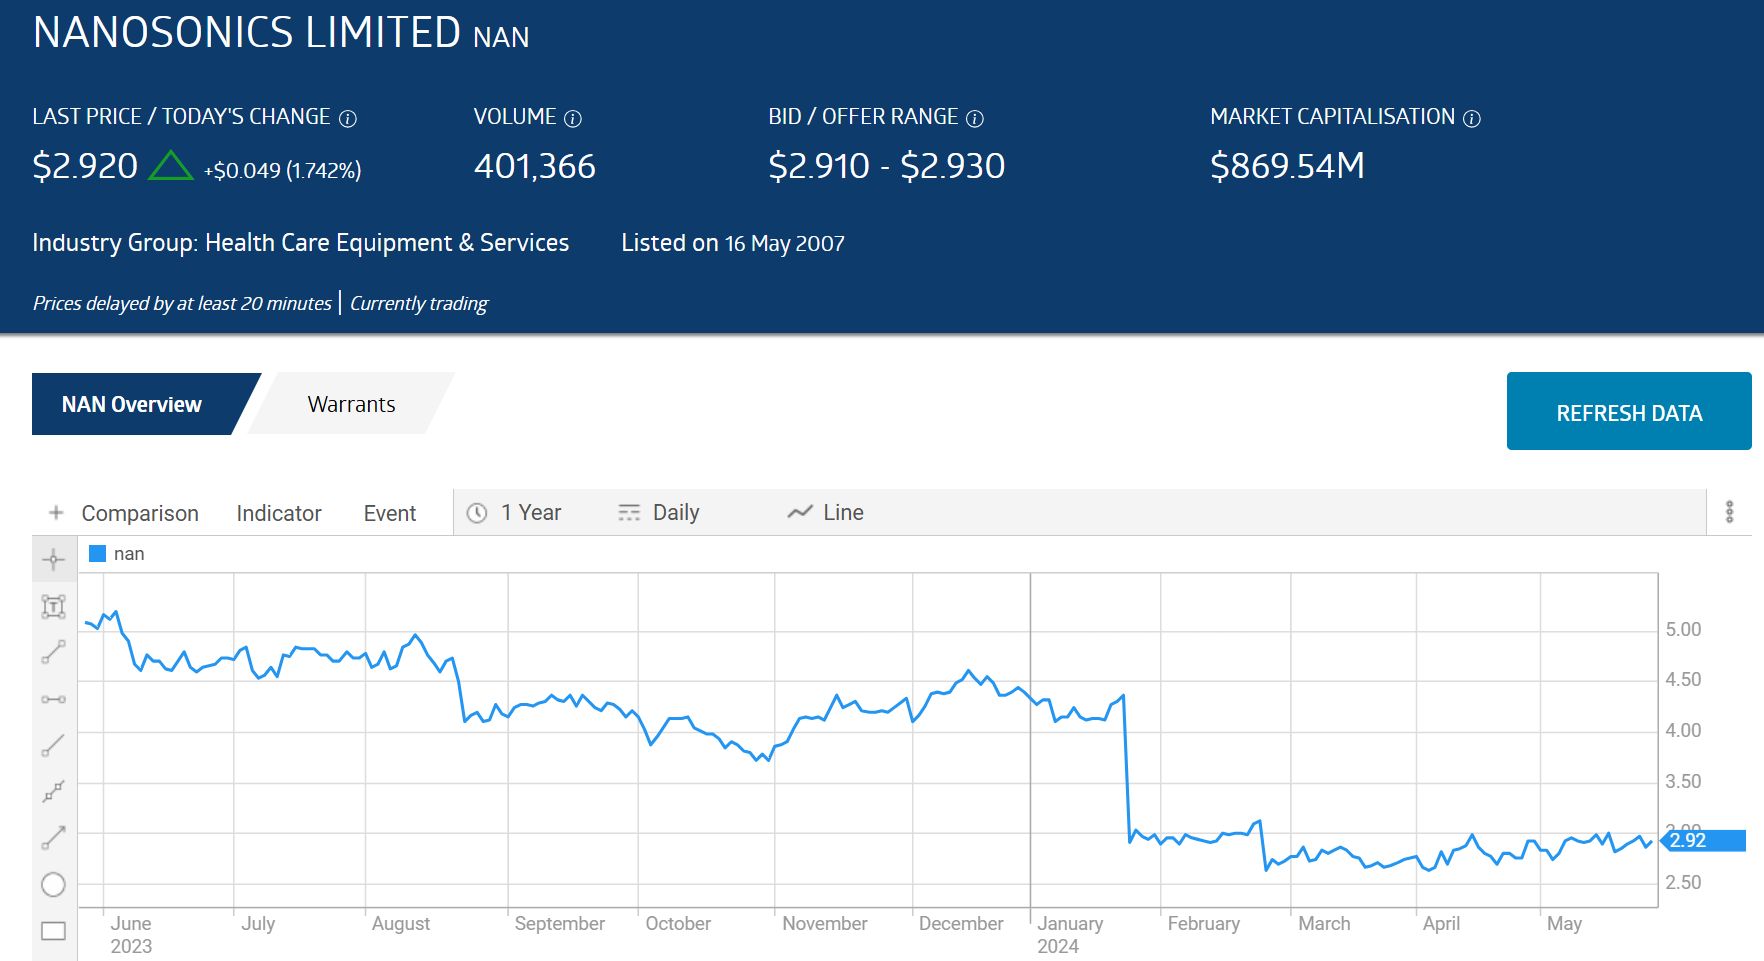
Nanosonics (ASX: NAN)
Nanosonics is a high-tech medical device company that manufactures and distributes the Trophon ultrasound probe disinfector, a device capable of preventing infections stemming from repeated use of ultrasound probes (transducer) without bacteria-killing cleaning.
The Trophon is software controlled, with Nanosonics also generating revenue from the sale of consumables, decontaminants, and other accessories associated with the Trophon device.
Nanosonics operates in more than 30 countries grouped in the North American region, Europe and the Middle East, and the Asia Pacific area.
Infection prevention is a growing concern in the medical field, and the number of ultrasound transducers in use around the world that need disinfecting provides massive tailwinds for Nanosonics.
As of 1st May 2023, the share price stood at $5.54 per share, falling to the current $2.92 following a devastating trading update issued in late January of 2024 pointing to an increase of the time frame for completing sales. The impact likely means lower revenues and profits with higher operating expenses contributing to the expected declines.
Source: ASX 27 May 2024
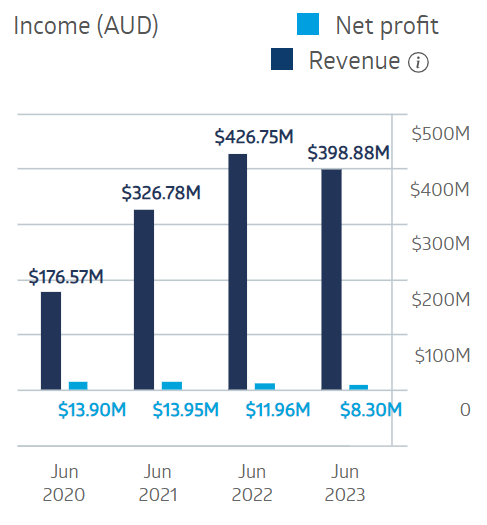
The company’s financial performance in FY 2023 seemed to indicate a full recovery from the Covid impact.
Nanosonics Financial Performance
Source: ASX 27 May 2024
Half Year 2024 financial results released in late February confirmed the bad news in the January trading update, with revenues down 2% and net profit down 40%.
Nanosonics now has a P/E of 57.14, down dramatically from its five-year average P/E of 132.3. The Wall Street Journal is reporting a HOLD rating on Nanosonic shares, with two analysts at BUY and OVERWEIGHT, six at HOLD, and two at SELL.
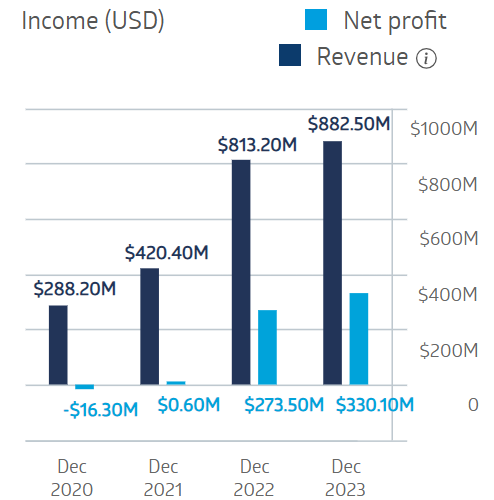
Arcadium Lithium (ASX: LTM)
The merger of Galaxy Resources and Orocobre into Allkem Resources has now morphed into yet another entity on the ASX – Arcadium Limited. Arcadium is the result of the merger between Allkem and lithium technology company Livent Corporation. The merger joins Allkem’s mining capabilities with Livent’s processing capabilities, creating a pure play end-to-end lithium company.
Financial results released in February reflect Allkem’s solid performance.
Source: ASX 27 March 2024
Arcadium’s outlook for 2024 is optimistic, projecting a 40% increase in lithium carbonate and hydroxide production and between $60 and $80 million in cost savings from realized syngergies.
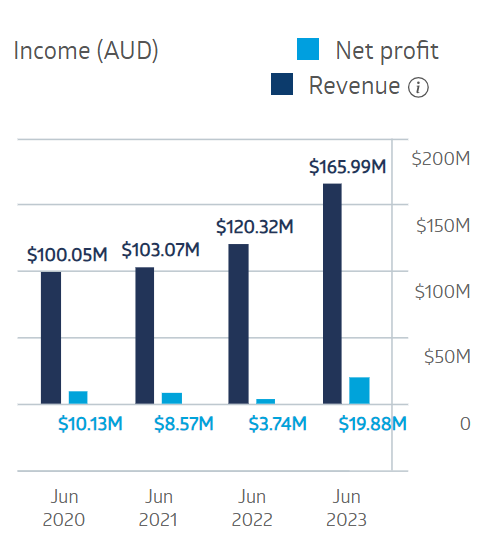
Airtasker (ASX: ART)
A relative newcomer to the ASX, Airtasker listed in March of 2021 with the share price down 78% through 27 May of 2024. The company has yet to show a profit but did reduce its posted loss between FY 2022 and FY 2023.
Airtasker Financial Performance
Source: ASX 27 May 2024
The company’s share price lags far behind its financial performance to date with increasing revenues. A few months after listing, Airtasker raised its IPO Prospectus guidance and announced that organic growth in UK and US markets was exceeding expectations, as well as the acquisition of a local services marketplace serving two US cities.
Half Year 2024 results were largely positive, with revenues across the board increasing – total revenues up 6.8%, marketplace revenues up 10.3% and UK revenues up 30%. While the company still posted a small loss, it was down 96.3% compared to the first half of FY 2023.
Airtasker provides a local digital marketplace where those in need of a service and those who can provide services can come together. Unlike peer-to-peer lending companies and job seeker sites, the Airtasker platform is an open marketplace, which includes virtually any service imaginable, from consumer home repair needs to small business needs and much more. Other sites that act as the middle person in a transaction are curated in that the services offered are curated or limited in scope. Airtasker operates in Australia and New Zealand, Singapore, Ireland, and the UK.
Summary
The factor that pushes some true growth stocks of today into the value stocks of tomorrow is the size of untapped market demand. Competition can saturate a market, as appears to have happened with the BNPL (buy now, pay later) market.
The total addressable market for local services is $52 billion dollars in Australia, $70 billion dollars in the UK, and $500 billion in the US.
Stocks that fail to grow are unlikely to fare well on the ASX over time. Stocks that grow revenues, earnings, and profit faster than other companies in their business sector and in the broader ASX as well are considered true growth stocks.
Growth stocks offer high rewards when their substantial growth expectations are met, with the risk of rapidly falling share price should the expectations not be met.