
For many economic forecasters, market experts, and professional and retail investors, the wait is over. The “other shoe” has dropped.
Markets came down with a severe case of the jitters when it became obvious rising inflation around the world would not ease without central bank intervention with rising interest rates.
The interest rates in question in the US are known as the Fed Funds Rate and here in Australia we have the RBA cash rate. In both cases, the interest rate sets the borrowing costs of unsecured loans between banks typically processed overnight, with the tentacles spreading to virtually all financial institutions collecting or paying interest.
The impact of these rates extends far beyond the most obvious – increasing mortgage rates on home loans. Virtually all businesses, large and small, borrow money at various times and rises in the RBA cash rate means higher loan repayments.
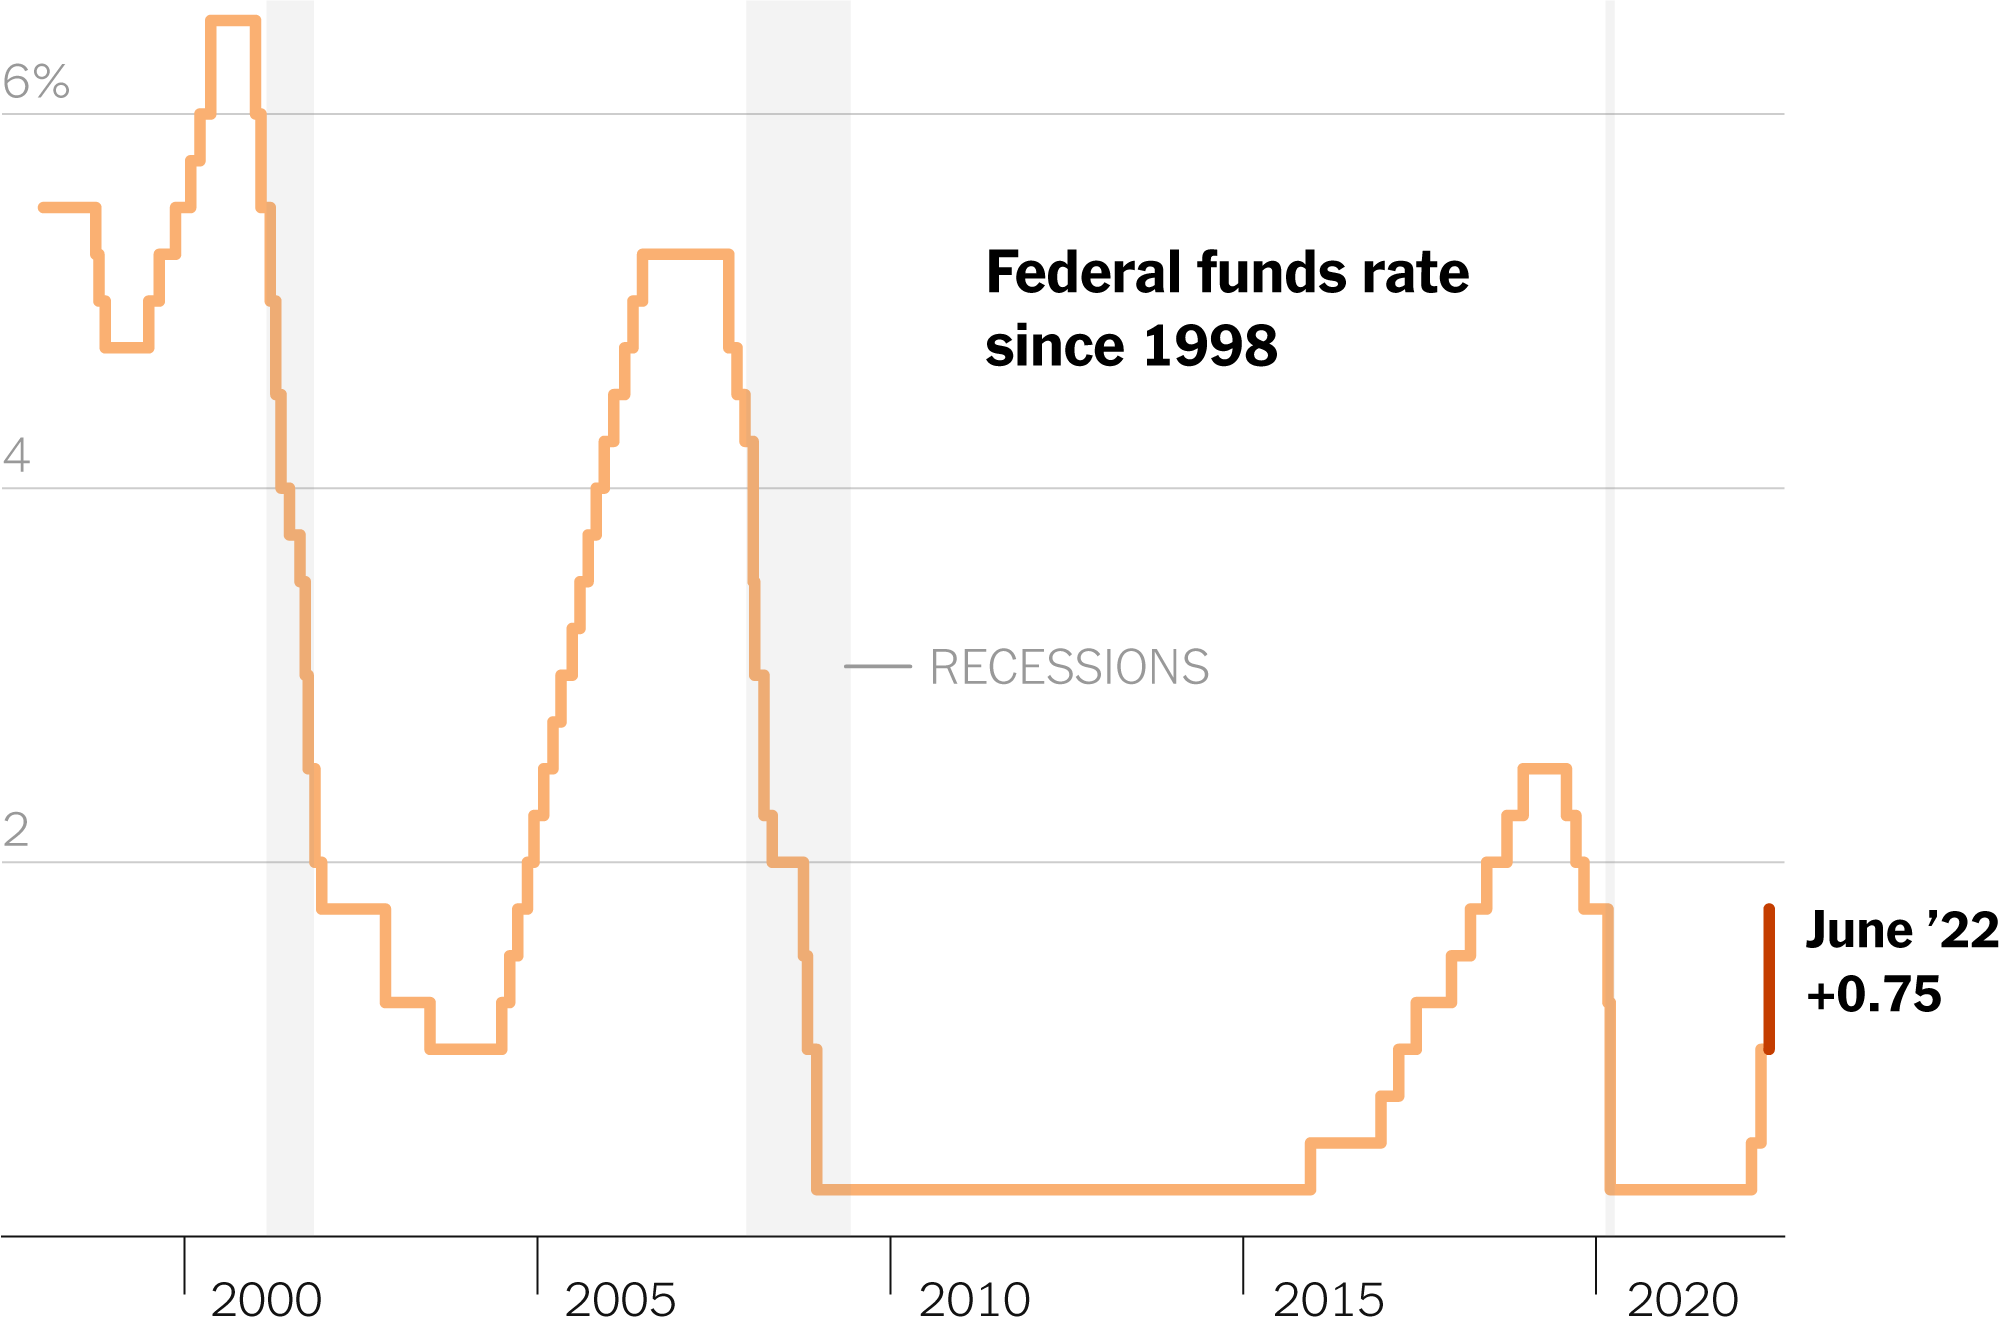
The following graph of the history of interest rates (Federal Reserve Funds Rate) dating back to 1998 is from a 15 June of 2022 article appearing in the New York Times.
Top Australian Brokers
- Pepperstone - Trading education - Read our review
- IC Markets - Experienced and highly regulated - Read our review
- eToro - Social and copy trading platform - Read our review
Interest rates remain at all-time lows following successive rate hikes, but this observation means literally nothing. The issue is how long can the US and other economies absorb rate increases before the resulting downturns in demand lead to a recession. The hope around the world focused on a “soft landing.” The rate increases would gradually work to reduce inflation without a recession. The measure that would tell the tale in the US is the Consumer Price Index (CPI).
What the August inflation report from the US did was in effect like dropping the proverbial other shoe, as it answered the prime question asked by investors around the world – are the rate increases working.
Although it is debatable that the data merited headlines like “hot” and “raging out of control” there is no question about its impact on share markets. It was bad, bad, and worse as it shouted to investors to expect the third consecutive 0.75% rate hike later in September with more to come. Some experts and analysts are even bandying about the possibility of a full one percent increase.
Headline inflation was us 0.1% month over month while economists had expected a decline of 0.1%. The more problematic number was core inflation – increasing 0.6%, doubling economist expectations for 0.3%. The annual inflation rate fell to 8.3% versus 8.5% in July but missed expectations of a drop to 8.1%.
The components of inflation measures are subject to a significant disparity of opinion. Why, for example, are food and energy prices not considered as “core” inflationary indicators? Headline inflation measures price increases in a “fixed basket of goods.”
To add to the confusion, the US Federal Reserve Bank focuses on a different measure from the Bureau of Economic Analysis – the PCE( Personal Consumer Expenditures). The PCE and the CPI both point to the same result – rising inflation. Regardless of the size and composition of the basket of goods, or the inflation measure of choice, there is no denying that inflation is a significant problem in the US, and around the world as well.
For investors clinging to the hope that interest rate hikes are beginning to work, some good news came out the day after the CPI with the announcement of another inflation indicator – the Producers Price Index (PPI).
The PPI measures the prices wholesalers receive for what they provide. Like the CPI, food and energy are not included in the monthly PPI report. Although this is a measure focused on the manufacturing sector which is declining relative to the service sector, the PPI can be a leading indicator of changes in CPI. Companies paying more to wholesalers have to choose whether and for how long they can absorb the costs and when they must pass on their increased cost to the consumer. The PPI dropped 0.1%.
Here in Australia the head of the Reserve Bank of Australia (RBA) Philip Lowe cited differences in the Australian economy that in his view merited reducing interest rate hikes Economists reported by Bloomberg see the previous 0.5% increase dropping to 0.25% . This would make Australia the first developed country to reverse course on interest rate hikes.
The Australian CPI is about to shift from three-month reporting intervals to monthly reports. The current inflation rate here is 6.1% up from last year.
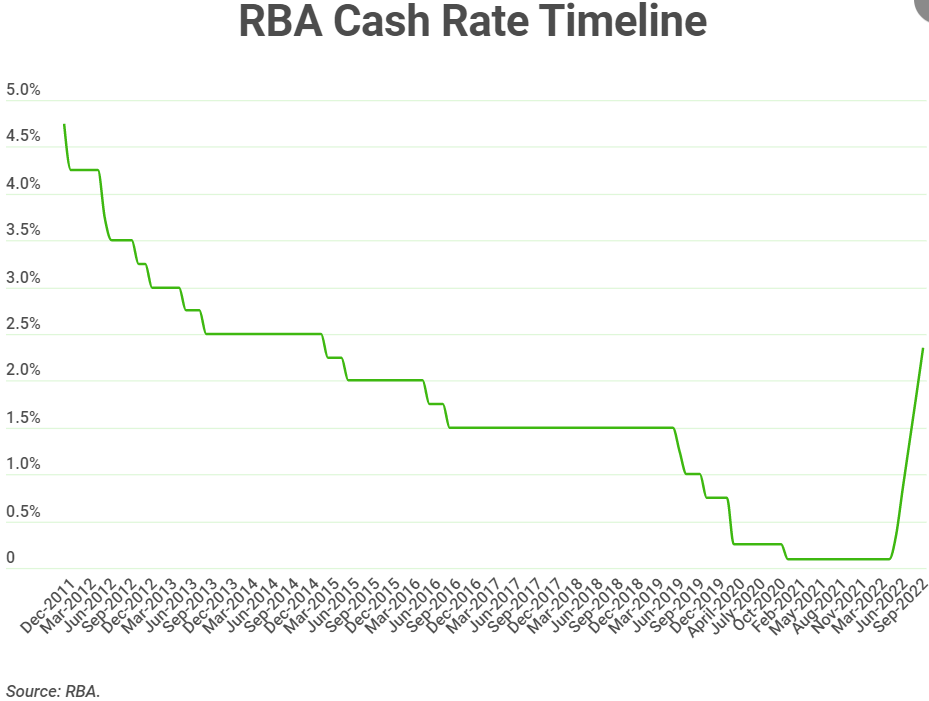
In both Australia and the US the cash rate or Fed Funds rate remains well below levels seen in the middle of the last decade. The website savings.com.au posted this graph from the RBA.
Most market analysts and commentators tell us financial stocks can benefit from higher interest rates, from banks to brokerage houses to insurance companies.
In the opinion of many, Australia is blessed with four of the strongest banks in the world. Yet they were not spared a panicky stampede of investors dumping their shares in the belief that the higher interest rates hitting consumers would decimate the banking mortgage loan business via a potential recession.
The Banks survived the GFC, a Royal Commission Inquiry, and a Pandemic.
The following table includes relevant historical share price and shareholder return performance as well as two year growth metrics for the Big Four.
|
Company (CODE) Market Cap |
Share Price |
52 Week High Low |
52 Week % Change Year to Date % Change |
2 Year Growth Forecast Earnings Dividends |
Total Shareholder Return 3 Year 5 Year 10 Year |
|
Commonwealth Bank of Australia (CBA) $160.1b |
$94.23 4.3% |
$110.19 $86.98 |
-8.38% -6.7% |
+15.7% +8.5% |
+9.4% +9.5% +10.8% |
|
National Australia Bank (NAB) $94.6b |
$29.96 4.7% |
$33.75 $25.43 |
+6.24% +3.88% |
+8.9% +13.1% |
+4.8% +4.5% +7.9% |
|
Westpac Banking (WBC) $75.3b |
$21.53 5.6% |
$26.44 $18.80 |
-17.19% +0.84 |
+5.9% +5.3% |
-6.3% -2.7% +4.3% |
|
Australia & New Zealand Bank (ANZ) $70.4b |
$23.55 6.0% |
$28.75 $20.78 |
-14.83% -13.7% |
-1.5% +4.5% |
-1.5% +0.7% +5.`1% |
National Australia Bank is the only one of the big four whose share price stayed in the black both year over year and year to date, the period of heaviest losses in equity markets. The bank also has the highest forecast for the metric that has investors choosing banks for long term investments – dividends.
As the impact of the COVID 19 pandemic became clear, a 13 May of 2020 article on the website euromoney.com article touted the dividend performance of the Big Four Banks. The authors claimed no blue chip banks on the planet paid higher dividends than our Big Four. In addition, Australian bank dividends are fully franked, meaning Aussie investors do not pay taxes on dividends twice, as do US investors.
Historically, what the Big Four have done during extreme economic downturns is reduce dividend payments rather than eliminate them. National Australia Bank ends its fiscal year on 31 August. For FY 2019 the bank paid $1.66 per share, dropping to $0.60 per share in FY 2020 before rebounding to $1.27 in FY 2021.
Once upon a time bank operations centered on taking deposits from consumers and some businesses and making loans to both. Today the big banks have expanded to offer insurance, wealth management, and brokerage services, but the net interest income (NII) from loans far outweighs non-interest income.
In FY 2021 non-interest income at NAB accounted for 22.6% of total income
While it is true higher interest rates means more interest income, they also introduce a significant risk element should interest rates reach the level that would discourage borrowing and increase loan defaults from both consumers and businesses.
Dissecting a bank’s financial performance forces investors to some surprising insights – loans made to consumers and businesses are assets, not liabilities, and deposits are liabilities, not assets. Banks are paid interest on the loans they make and must pay out interest payments on deposits.
Profitability is heavily influenced by two metrics – the interest rate spread and the net interest margin (NIM).The interest rate spread is the difference between the average yield the bank receives from the interest rate on loans and the average interest rate the bank pays out on dividends. .
Net interest margin divides the total net interest income from loans by the total interest amount paid out to certificate of deposit and savings account holders. .
Key Metrics for National Australia Bank for FY 2021:
- Interest rate spread was 1.5%, down from 1.7% in FY 2020.
- NIM was 1.5% down from 1.6%.
- Total net interest income dropped 6.9%
- Total non-interest income (fees, service charges) rose 12.9%
- Underlying Net Profit after Tax (NPAT) fell 6.8%
- Dividend payments rose 111%.
Half Year 2022 Financial Results were compared with FY 2021 results for the second half of the year. Underlying profit was up 10.2%
In August of 2021, the bank acquired Citigroup Australia’s consumer business, including home and unsecured lending, retail deposits, and wealth management services.
Each of the Big Four banks is looking to lure the younger demographic with new and improved technology in their platforms, apps, and services. NAB has brought on 1,500 tech specialists to push the bank’s “digital transformation.”
Commonwealth Bank of Australia is our largest and one of the oldest banks, in operation for 110 years. The title of oldest Australian Bank goes to Westpac Banking Corporation, established in Sydney in 1817.
Commonwealth Bank has the best record of historical shareholder return and the highest two year earnings growth forecast. Commonwealth Bank is the only one of the Big Four to offer select customers broadband internet service and current rumours from The Australian include CBA as a potential suitor to acquire Vocus Retail. The bank is a leader in the digital transformation of banking services, with an impressive mobile app, a claims assessment platform powered by artificial intelligence (AI) and its own BNPL (buy now pay later) platform – StepPay.
Commonwealth Bank follows fiscal year reporting, closing its books at the end of June. Here are some relevant metrics for FY 2022:
- Interest rate spread was 1.6%, down from 1.7% in FY 2020.
- NIM was 1.9% down from 2.03%.
- Total net interest income rose 2.8%
- Total non-interest income (fees, service charges) rose 12.9%
- Underlying Net Profit after Tax (NPAT) rose 6%
- Dividend payments rose 10%.
Westpac Banking Corporation’s share price got a boost with back-to-back positive notes from Citi and Goldman Sachs – both with BUY recommendations and a $30 price target from Citi and $26.55 from Goldman.
On 15 September, the bank announced new feature additions to its mobile app focusing on personal financial management. The improvements include the ability to track and categorise expenses and budgeting tools.
Westpac reports full year results at the end of September. Here are some relevant metrics for FY 2021:
- Interest rate spread was 1.98%, up from 1.90% in FY 2020.
- NIM was 2.06%, up from 2.03%.
- Total net interest income rose 1%
- Total non-interest income (fees, service charges) fell 6.9%
- Underlying Net Profit after Tax (NPAT) rose 158%
- Dividend payments rose 280%.
Australia and New Zealand Bank has struggled of late with both institutional and retail entitlement offers missing the target of funds to be raised. In July, the bank launched major improvements in a new mobile application called ANZ Plus. In less than three months consumers have moved $500 million dollars onto the platform with the current 40,000 customers growing by “thousands per week” according to bank officials.
Here are some metrics for ANZ Bank from FY 2021:
- Interest rate spread was 1.6% flat on FY 2020.
- NIM was 1.63% down from 1.64%.
- Total net interest income was up 0.79%
- Total non-interest income (fees, service charges) fell 13.3%
- Underlying Net Profit after Tax (NPAT) rose 72%%
- Dividend payments rose 136%.
Much of the analyst community is positive on the big banks, with only ANZ and CBA with single SELL recommendations. The dividend growth reported by 3 of the 4 offer evidence in favor of the banks. Dividends were cut in the face of COVID 19 but rebounded sharply.
The following price movement chart for NAB is from the ASX website.

The other three Big Banks show the same pattern – uninterrupted, fully franked dividend payments.
Finally, although it appears a current majority of share market participants are convinced interest rate hikes will continue, with a very real possibility of a recession, there are some who disagree.
An opinion piece from Peter Switzer on Switzer Daily was penned as the US market was in freefall. Switzer shared a graph from Shane Oliver’s economics team at AMP Capital suggesting inflation may be declining. The AMP team used multiple measures to create a “pipeline” of inflation indicators. Here’s the graph:
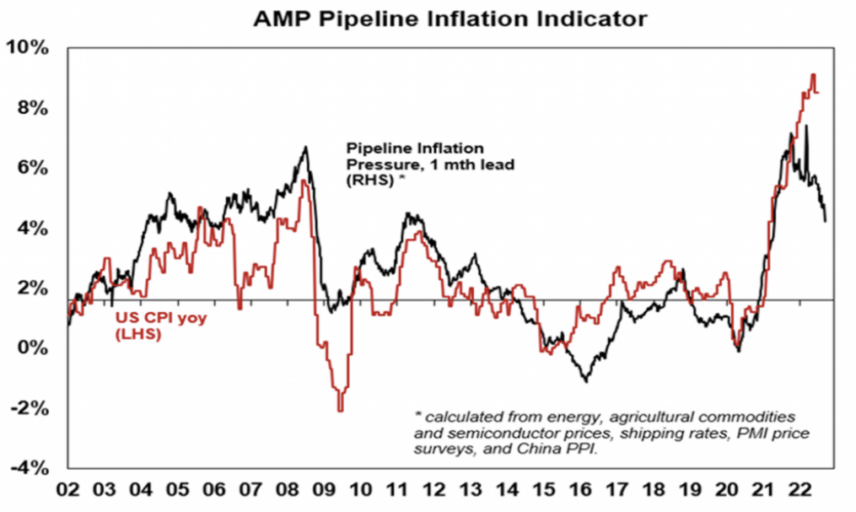
The pipeline components are leading indicators prefacing a drop in the CPI as price declines filter down. That is the hope.