
Pairs trading involves first identifying the correlation of the price action of two stocks in similar sectors with similar business models. When the stock price of two highly correlated stocks begins to go in opposite directions, investors can take a long position on the stock dropping in price and a short position on the stock rising in price.
In the 1980’s a group of quantitative analysts at US investment bank Morgan Stanley developed what would become a revolutionary investing strategy – pairs trading. Nicknamed the “Quants,” these market researchers employed the mathematical and statistical techniques at the heart of quantitative analysis to analyse both financial and stock market data in search of new and improved investing strategies for more profitable trading.
Price ratios and the mathematical relationships of similar stocks led to the discovery. Pairs trading was quickly adopted by the big investment banks, hedge funds, institutional investors and have since entered the world of retail investors of all kinds.
What is Pairs Trading?
Share market investors at all levels appear to be more interested in minimising losses than they are in maximising profits. Given two trades – one with higher profitability but more risk and a second with lower profitability at reduced risk – investors prefer the safer trade.
Top Australian Brokers
- Pepperstone - Trading education - Read our review
- IC Markets - Experienced and highly regulated - Read our review
- eToro - Social and copy trading platform - Read our review
Newcomers to share market investing are reminded constantly there are no “sure things” in the stock market, yet pairs trading comes as close as possible to the elusive sure thing. Pair trades are market neutral – meaning they work in all market conditions.
Market neutral strategies are designed to avoid risk by hedging both long and short positions on two similar stocks. In pairs trading investors look for stocks that are statistically highly correlated. When the price of the two similar stocks starts to “spread” or go in opposite directions the investor takes a long position on the stock declining in price and a short position on the stock priced above the long stock in the pair. The long and short position must be of equal value.
The correlation history assumes eventually the two stocks will go back to their historical pattern. The pair trade makes a profit on the net difference between the profiting position and the losing position.
The Pros and Cons of Pair Trading
Profit potential is the major advantage of pair trading. The long and short positions in the trade create a hedge between them. Another advantage is the market neutrality of the trade. Pair trades can work in range bound markets along with up trending markets and downtrend markets.
For the average retail investor in the age of algorithmic and machine trading, one could make a strong case the “cons” of pair trading outweigh the “pros.”
The success of a pair trade depends on an accurate appraisal of the correlation between the two stocks paired in the trade.
Correlations range from +1 to -1, with +1 being a perfect correlation as both stocks move upward in unison, with a correlation of -1 indicating both stocks are dropping in unison. Correlations from between +1.0 and 0 indicate divergence, with the higher the correlation the stronger the separation between the two stocks.
Experts tell us the minimum correlation for a pair trade with a high probability of success is 0.80, with correlations as high as 0.95 preferred. If the 0.95 correlation drops to 0.50, the divergence suggests a long/short pair trade should work.
However, in market crashes like the Great Financial crisis both stocks might plunge equally while remaining divergent, maintaining the correlation of 0.50. For a successful trade, the correlation between the two stocks needs to return to its historical norm.
Hedge funds, institutional investors, and the trading desks at investment banks all have access to high speed automation that can identify highly correlated stocks and issue alerts when those correlated pairs diverge enough to statistically warrant a lower risk pair trade .
In the past, retail investors did not have access to the trading hardware and software available to professional investors, arguably the most important disadvantage for retail investors.
Now, some stock screeners allow high and low correlations as search variables. Some of the best (and potentially more expensive) online trading platforms have access to software that can both identify highly correlated stocks and those that diverge or spread. Some paid financial websites can get correlation coefficients for two ASX stocks, as can dedicated trading software.
Intrepid investors can get a coefficient by hand from the CORREL function in EXCEL after downloading historical price data from a website like yahoofinance.au.
Another “con” for retailers is accurately accessing the divergence of two highly correlated stocks that are moving in opposite directions. How far apart do they have to be?
The simplest answer is a change in the Pearson correlation coefficient to a mid-level around 0.5.
A more precise answer involves changes in the price ratio of the two stocks. The price ratio is found by dividing the closing price of the higher stock by the closing price of the lower stock on a day the correlation is high.
The most complex method is to first calculate the mean average spread between the two stocks over a period of time. If the spread rises more than two standard deviations above the mean it may be significant enough to warrant a pair trade.
Back testing available on many trading platforms allows setting a percentage threshold difference between the two stocks and back testing a sample trade.
A Pairs Trading Example
Here is a simple example based on multiple assumptions.
The ABC company and the XYZ company are similar enough to attract the attention of an investor ready to look into pair trading opportunities. Monitoring shows similar price action with minimal spread showing on the lines of the chart. The investor found a source for Pearson correlation coefficients between the two stocks – 0.95. Within days a spread between ABC and XYZ widens as the ABC share price falls. Assuming the investor finds a way to measure the spread and finds it significant, the investor takes a long position on ABC and an equal short position on XYZ. In due time, ABC’s share price rises to slightly exceed XYZ returning the pair to a correlation of 0.95. Closing both positions, profit from the short position offsets the loss from the long position for the investor.
Australian Stocks for Pairs Trading
Pair trading here in Australia is arguably more challenging than for US investors who have close to three times more stocks from which to choose. As of 2024 there are about 2,154 stocks on the ASX and around 6,000 on the three major US exchanges.
The ASX does have the big four banks with two of them operating in sync for most of the past year with a spread opening in the last two months – Westpac Banking (WBC) and National Australia Bank (NAB).
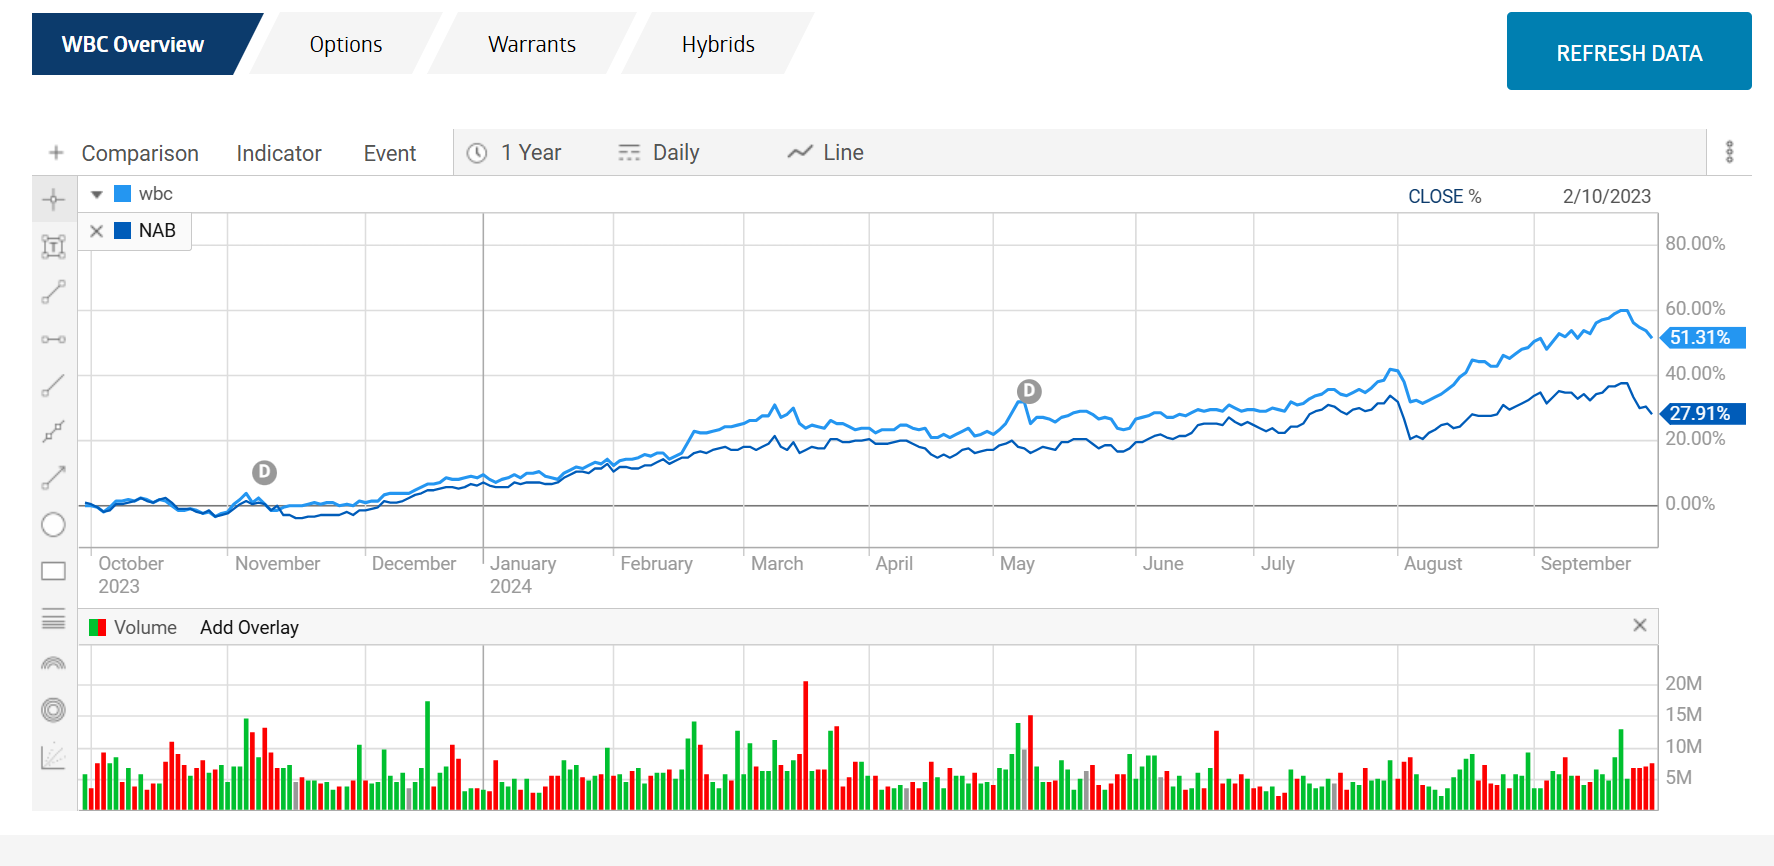
Source: ASX
Miners BHP Group (ASX: BHP) and RIO (ASX: RIO) provide a better example.
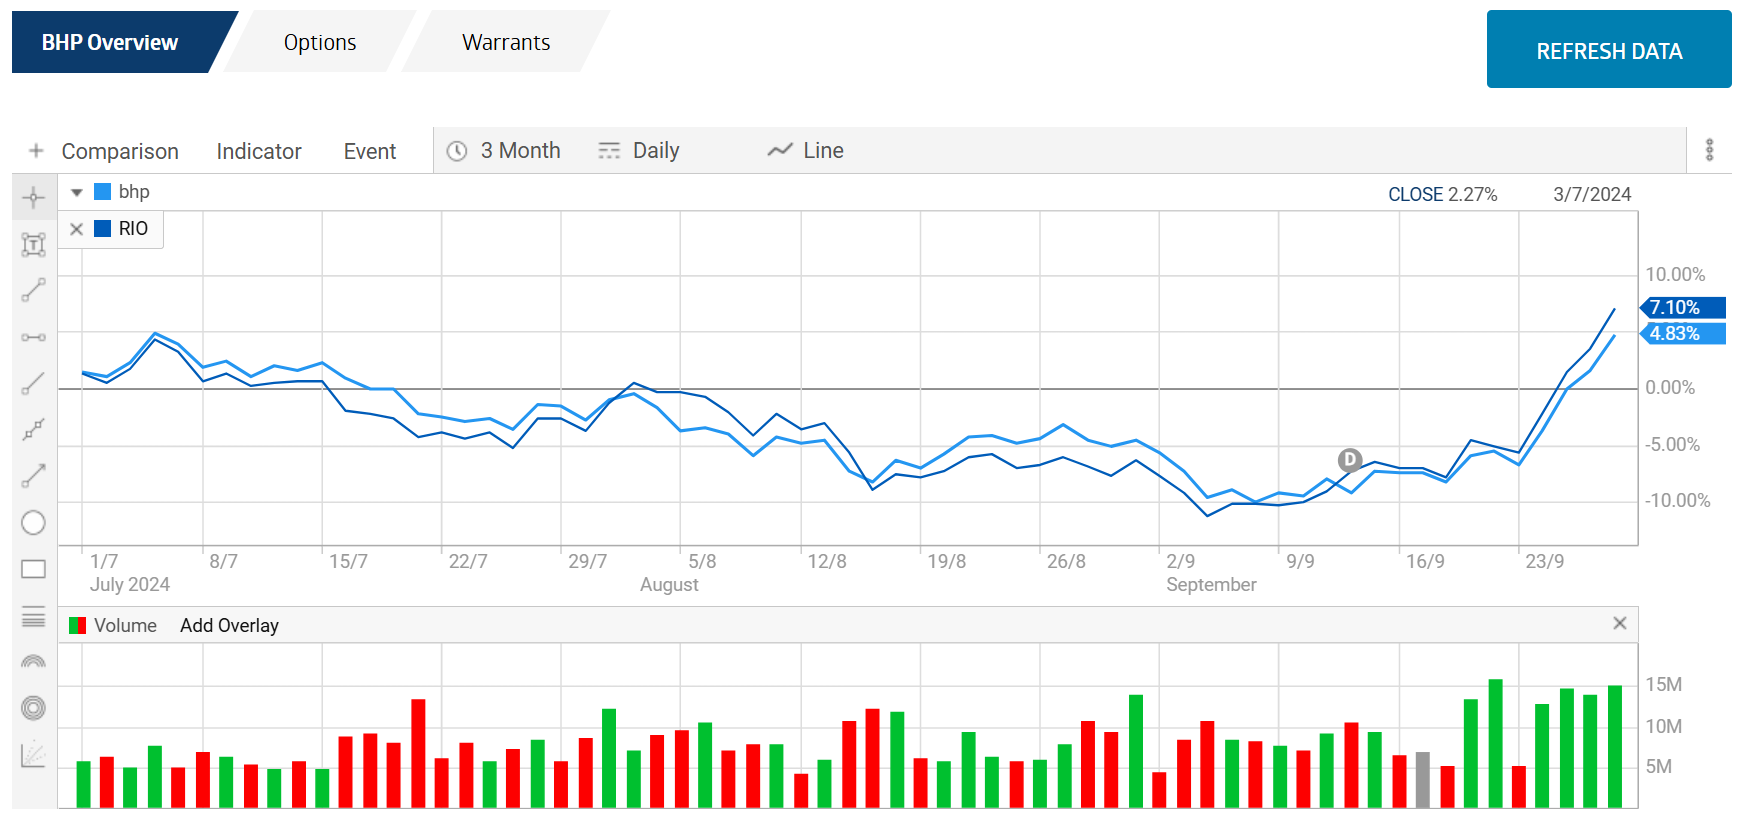
Source: ASX
Other example pairs to research are gold miners, Northern Star Resources (NST) and Evolution Mining (EVN), grocery retailers Woolworth’s Group (ASX: WOW) and Coles Group (ASX: COL), and lithium miners Pilbara Minerals (ASX: PLS) and Liontown Resources (ASX: LTR).
Pairs trading is a hedging investment strategy that minimises risk. Using two stocks that trade in similar fashion – rising up together and falling together — with a reasonable spread between share prices, investors monitor the stocks to see when they diverge – when the spread widens.
A pair trade involves investing equal amounts in taking a long position on the lower priced stock at the time of the spread and a short position on the higher price. When the prices of the two stocks return, or converge to their normal spread, the investor exits the position with profits from the long trade offsetting losses from the short trade.
Determining the BUY signal for pair trades is complex, beginning with quantifying the correlation of the price action of the two stocks and then assessing the strength of the spread.