Trading with the MACD (Moving Average Convergence/Divergence) Indicator
Fundamental analysis is the most common entry point for first-time investors in the stock market. This approach involves a study of a company’s business model, financial statements, and placement within the economy in which the company operates.
Early on in the search for determining what stocks to buy and when, investors are exposed to the value of price movement charts found on most online financial websites. This inevitably leads to the discovery of a radically different approach to determining stocks for investing – technical analysis.
Technical analysis is underpinned by the Efficient Market Hypothesis (EMH) which believes the kinds of information uncovered in fundamental analysis is already known by all participants in the market, and therefore are “baked into” the share price.
This assumption frees proponents of technical analysis to make investment decisions based solely on the history of movements in the share price and trading volume of a stock targeted for investment.
Technical analysis originated with Charles Dow in the late 19th century starting with Dow theory and the critical importance of price trends moving in predictable patterns over time. Today there are a wealth of technical analysis tools, with the MACD among them.
Top Australian Brokers
- Pepperstone - Trading education - Read our review
- IC Markets - Experienced and highly regulated - Read our review
- eToro - Social and copy trading platform - Read our review
Understanding the MACD
The moving average of a stock price over time is the starting point for many technical analysis indicators. There are simple moving averages –adding the closing price of a stock over a period of time and then dividing by the days in the time period. Exponential moving averages improve on the simple moving average by giving higher weighting to the most recent data points.
The MACD is used to spot and confirm a continuing price trend or a changing trend. This allows technical traders to operate successfully in both bullish and bearish markets, taking long or short positions depending on the status of the price trend.
The MACD uses two exponential moving averages of a targeted stock, one fast and one slow. The MACD is calculated by first taking an EMA over a period of 26 days and one over 12 days, and then plotting the difference between the two averages across the zero line on a stock’s price chart as the MACD line. The final step is another exponential moving average tracking the MACD over a nine day period. It is the signal line that will alert traders to potential trades.
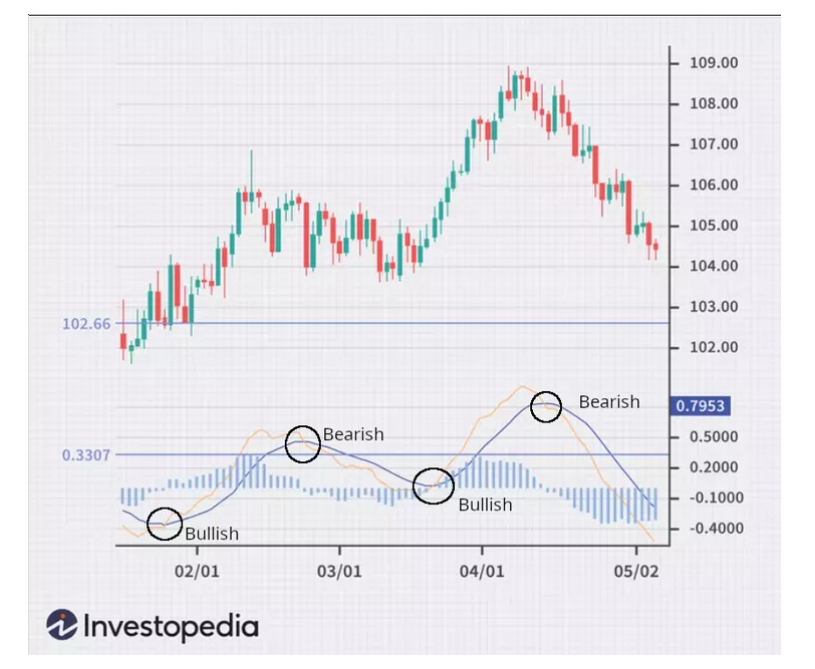
Price charts on financial websites have an Indicator button which when pressed will display a list of technical indicators. Pressing MACD will plot everything you need on the stock’s price chart. The difference between the signal line and the MACD line appear on the price movement chart as a histogram at the bottom of the chart. From Investopaedia.com, here is an example:
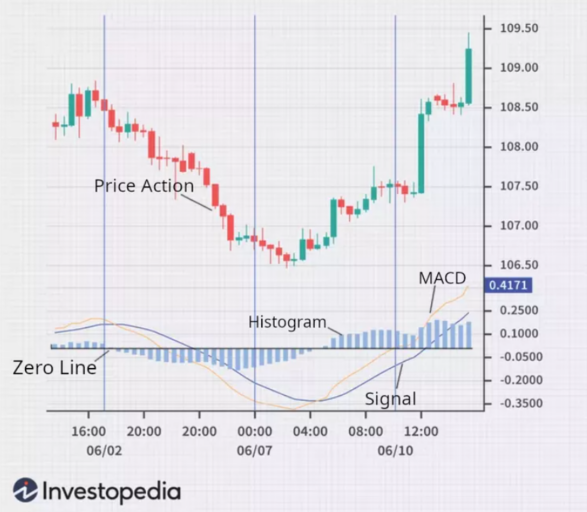
When the histogram values drop below the zero line that is an indication of a weakening trend, and above the line a sign of a continuing trend. Increases in the histogram values indicate a strengthening trend.
Divergence and Crossovers with the MACD
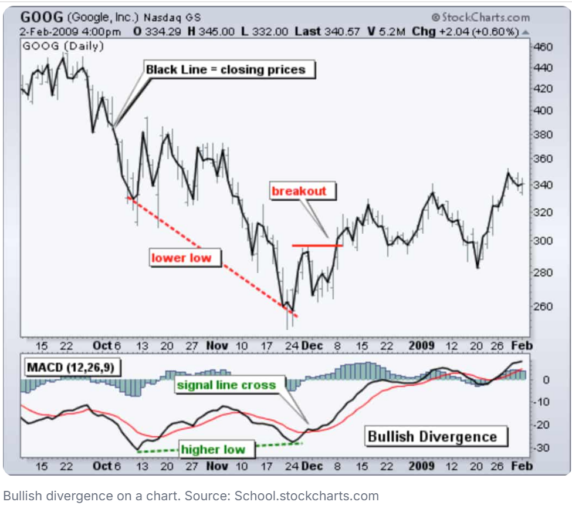
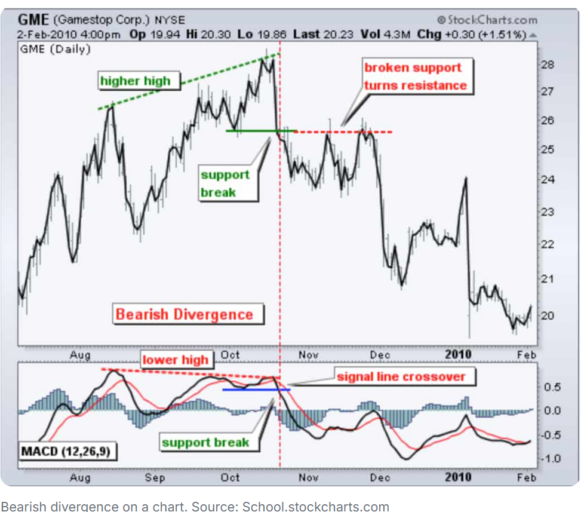
When the MACD and the signal line are moving together, that is convergence. Divergence occurs when the two lines move in different directions with the stock price and can be a bullish or bearish signal, as seen in the two example price movement charts from Stockcharts.com appearing on the finbold.com website.
When the stock price is making lower lows while the MACD is making higher lows, you have bullish divergence, suggesting the possibility of upward momentum.
Bearish divergence occurs when the stock price is making higher highs while the MACD is showing lower highs. The divergence may be indicative of a downward momentum.
Signal Line crossovers also indicate momentum changes. If the MACD crosses above the signal line (the MACD’s 9 day EMA), that is a bullish sigh. The MACD crossing below the signal line is bearish, as seen in the following example chart from Investopaedia.com.
The Drawbacks of the MACD
There are complicated crossing patterns that can yield false signals but perhaps the biggest drawback to the MACD is the kind of market where it best works. In range-bound markets moving sideways, it does not perform well. The MACD is most useful in markets trending up or down.
Divergence shows weakening momentum within a trend indicating a possible reversal but does not always accurately spot the timing of the reversal.
Finally, the MACD is a lagging indicator, sometimes causing a miss in timing of entry in a long position as the stock price can be above the prior low before the MACD crosses the signal line.
Combining the MACD with Other Indicators
The MACD is an oscillating indicator moving between extreme values and works well with other oscillating indicators, most notably the RSI (Relative Strength Index).
The RSI can be added as an additional indicator with the MACD. It measures the strength of a trend against both overbought and oversold conditions. Depending on baseline levels set by the individual trader, the RSI provides buy signals when the price crosses into oversold conditions and sell signals when the price crosses into overbought conditions.
Simple Moving Averages (SMA) are another indicator with the three working together to confirm continuing or reversing trends.
What is Elliot Wave Theory
Elliot Wave Theory can also be combined with the MACD to improve trading strategies. The theory posits that financial markets move in “wave” patterns that are predictable. The theory identifies five upward moving impulse wave patterns and three downward moving corrective wave patterns.
Traders use Elliot Wave Theory to spot the wave patterns on a targeted stocks price chart to predict future changes in price movement. The MACD can confirm wave counts and divergence can signal a change in the wave pattern from impulse to corrective when the share price makes a new high but the MACD does not.
MACD is one of the most-used oscillating indicators in the technical analysis tool box as a method of identifying both momentum and trend reversals. The ability to measure momentum and identify trends makes MACD one of the most versatile of all technical indicators.
MACD is best suited for trending, not range bound markets and is not adept to spotting overbought or oversold conditions. Combining the MACD with the RSI enhances both tools. The MACD is also helpful to traders using Elliot Wave Theory.


