
How Low is Low Enough in Buy Low/Sell High Investing?
Buy Low/Sell High is one of the most cited adages in the world of share market investing. Newcomers to stock investing coming across Buy Low/Sell High learn it is a catch phrase for an investing strategy that seems obvious. When newbies actually think about using the strategy the challenge with this seeming common sense approach is this – how “high” is “high” and how “low” is “low.”
Buy Low Sell High
For many investors, Buy Low/Sell High is the cornerstone principle of all investing, regardless of approach and strategy. Search for stocks when the share price is low and sell the stock when the share price is high, pocketing the difference in profit.
It is a market timing strategy that calls for accurately predicting reversals, or shifts, in the movement of a stock’s share price.
Many market experts advise retail investors that attempting to accurately time the market is a fool’s errand, even for the most experienced among them. Market timing strategies are the holy grail sought by the investing community. No foolproof strategy exists, yet all investors need some framework for making buying and selling decisions. For many, the framework begins with an understanding of what moves the price of a stock.
Top Australian Brokers
- Pepperstone - Trading education - Read our review
- IC Markets - Experienced and highly regulated - Read our review
- eToro - Social and copy trading platform - Read our review
There are three events that can act as a catalyst for a price reversal from upward to downward or from downward to upward in markets.
Market Cycles and Market News
Price action in markets is driven by the greed/fear cycle. In times perceived to be good in an entire market, specific business sectors, or individual stocks, investors get greedy. Stock prices rise with seemingly no end in sight as investors flock to buy, buy, and buy again.
News fuels the frenzied buying as more and more financial analysts and economists tell us we are basking in the midst of an economic boom. The cycle inevitably shifts, again driven by news from economists and experts looking at business activities in their respective countries. When enough of them begin to speculate the boom may be ready to burst, the investing community gets fearful of a coming recession or perhaps even a depression. Now we begin to see frenzied selling.
The same cycle applies to business sectors and individual stocks. The technology sector has struggled over the last few years, as has segments of the mining sector, most notably lithium.
Mining and biotechnology stocks rock and roll on announcements of positive drilling or clinical results.
The fear/greed/fear/greed cycles are often extreme which might explain another market adage -markets shoot first and ask questions later.-
What is Low and What is High
The current price of a stock taken alone is meaningless without context or background, beginning with historical price patterns and ending with an attempt to explain the rationale for the reversal or momentum shift.
The shoot first adage is an apt characterisation of how the market reacts to market cycles and news announcements – they react by buying or selling without the context behind the shift. The herd mentality trumps the rational response of researching the event before buying or selling.
Investors who favor fundamental analysis might react to a significant drop in a biotech announcement by digging into the details of an event like a supposedly negative announcement of the results of a clinical trial from the US Food and Drug Administration (FDA). In many cases the FDA has not denied approval for the drug but simply asked for mor information, yet the market “shot” and drove down the price.
The challenge for investors considering that biotech stock is best characterized by another market adage – beware the falling knife. Looking at the price history of the biotech stock tells investors the price is low but the challenge is how can you tell you will not catch the falling knife as it goes lower and lower. The perfect market timer would know when a falling stock bottoms out and when a rising stock tops out.
For long term investors who believe the fundamentals of the stock in question remain sound, catching the falling knife is less painful as market history shows quality stocks rebound over time.
Investors who favor technical analysis have multiple technical indicators that, although not 100% accurate, can be used to determine highs and lows that trigger BUY and SELL signals. One of the easiest to use is the RSI (Relative Strength Indicator).
The share price movement charts on the ASX and most other investing websites have a row of buttons at the top of the chart. Clicking the Indicator button will display a list of available technical indicators. On the ASX site, the RSI is a sub-heading under Momentum Indicators.
The RSI calculates average gains and losses of a targeted stock over a set period of time, usually fourteen days. When the gains meet or exceed an RSI of 70 they are considered Overbought and ready for a reversal. When the gains fall at or below 30 they are considered Oversold and may be ready for an upward reversal.
From the ASX website, here is an RSI added to a one year price movement chart for global logistics company Wisetech Global (ASX: WTC).
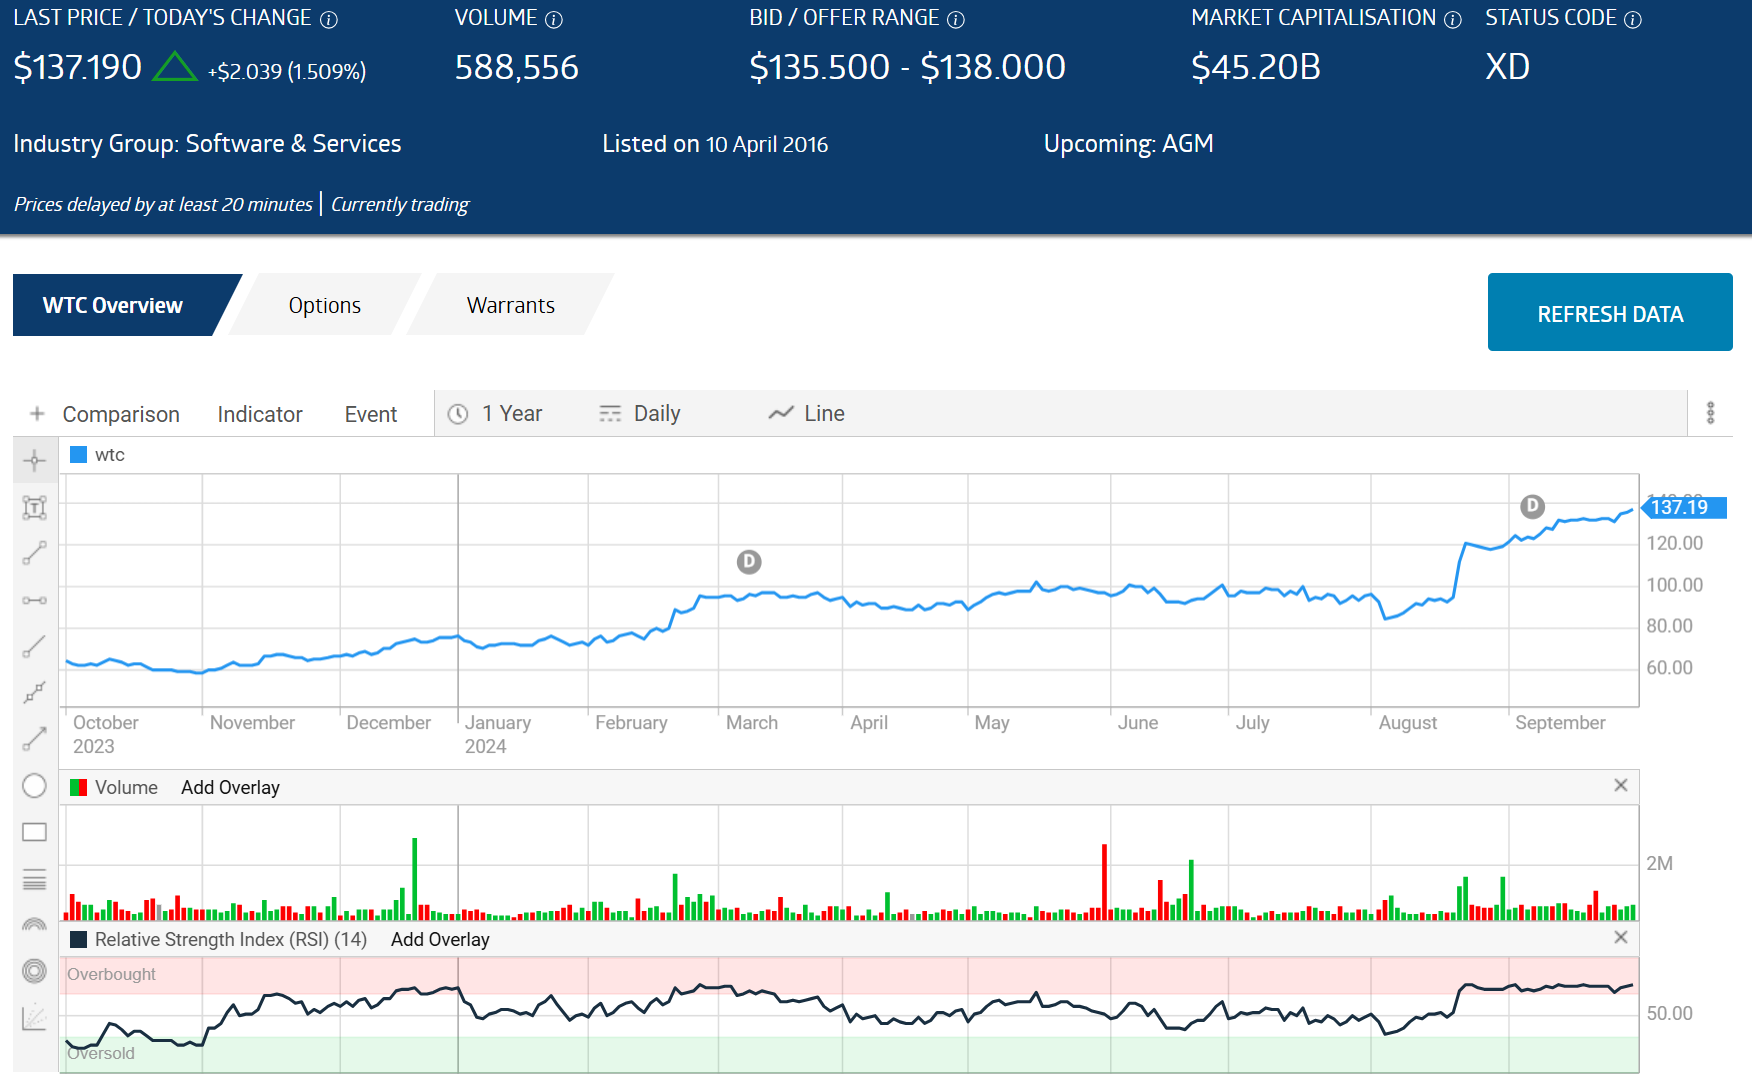
Source: ASX
If you compare the points when the RSI touched seventy or thirty you can see the indicator correctly identified the trend reversal most of the time but missed the sideways trade instead of a down trend in mid-August. It is debatable whether any movement to overbought of oversold status came early enough for an investor to timely enter or exit a stock.
Some technical analyst experts suggest the RSI is least effective in strong trending markets while virtually all recommend using other technical indicators to confirm whether the RSI’s oversold and overbought conditions are reasonable characteristics of how low is low and how high is high.
Simple Moving Averages (SMA), also available for use from share price movement charts is another helpful and easy to understand indicator.
Moving averages calculate the average closing price of a stock over a period of time. The Moving Average Indicator most often uses two – one set at 50 days and the other at 200, although the user can adjust the time frames.
When the 50 Day MA crosses above the 200 Day MA, an upward trend reversal is likely. When the 50 Day crosses under the 200 Day, a downward trend is likely. Here is the SMA technical indicator added to the WTC chart.
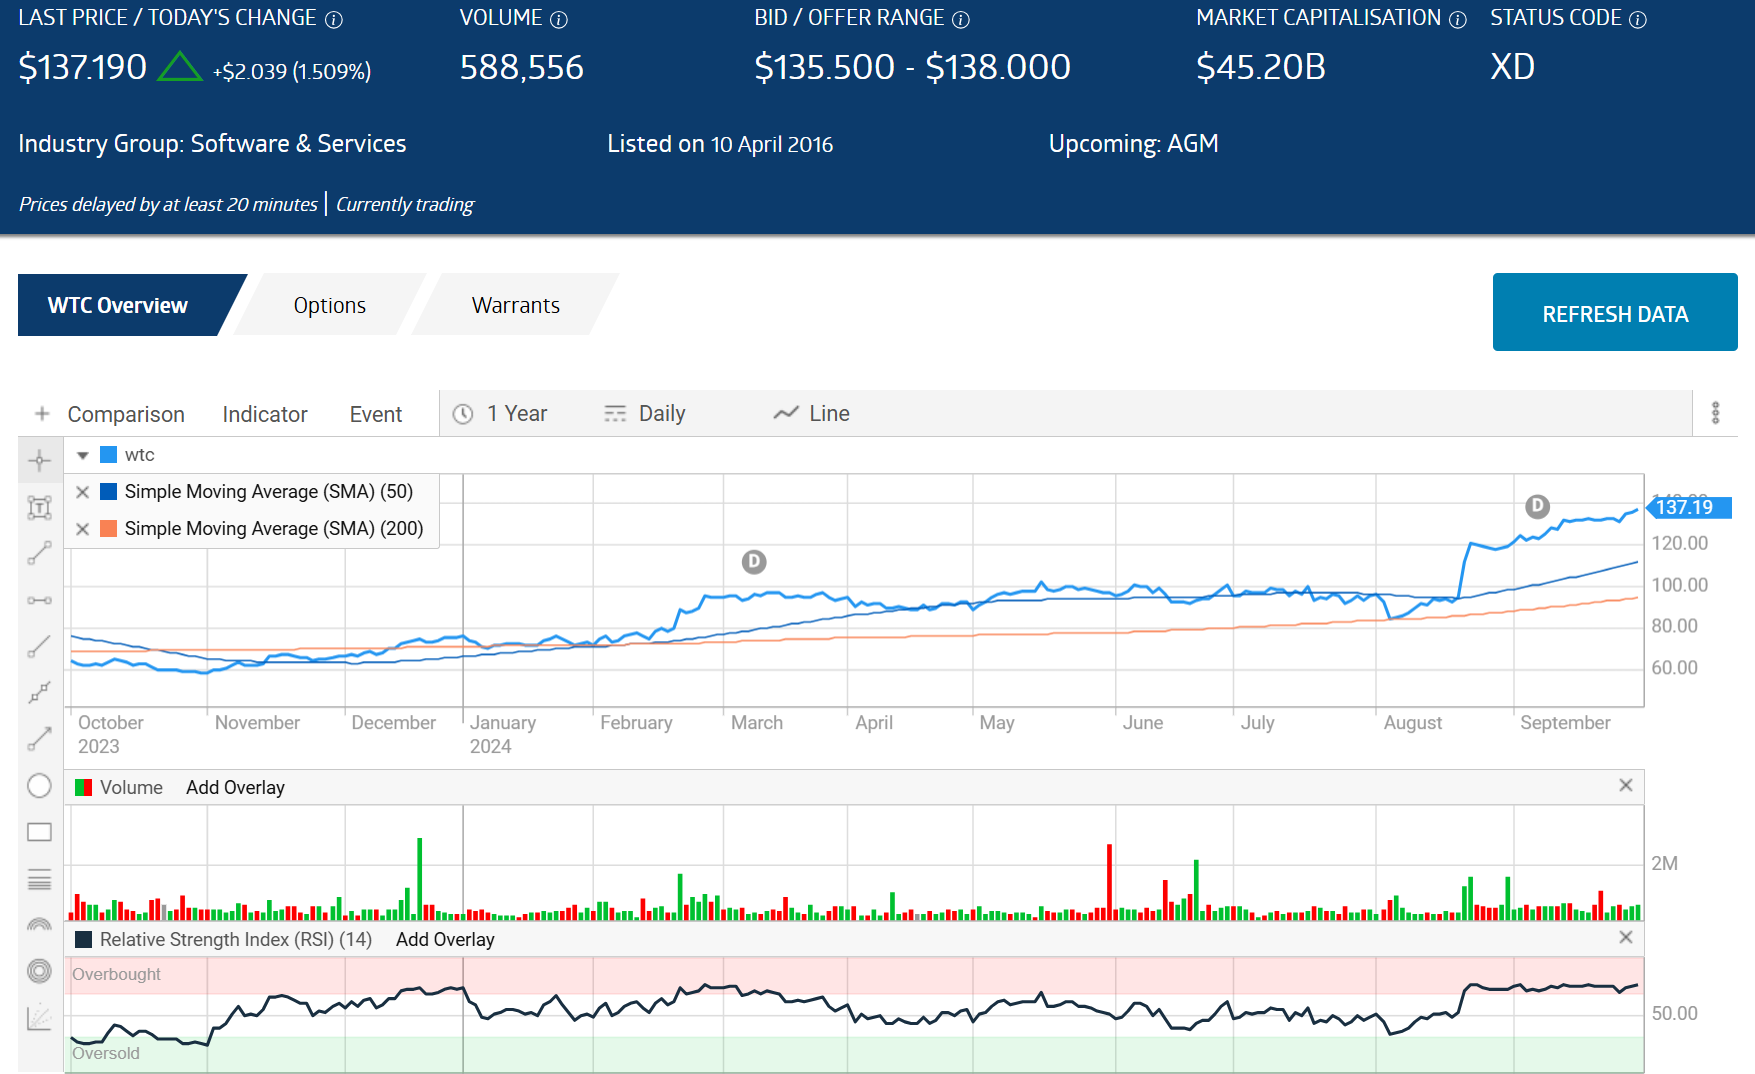
The SMA failed to spot the trend reversal that started in early August of this year.
Long term investors have the luxury of ignoring the how high is high and how low is low. The answer in both cases is whatever numbers led to a profit when the trade is closed, short of bankruptcy on the low end.
Buy High, Sell Low
Cynics describe the trading approach of many retail investors as Buy High, Sell Low. Retailers who follow the herd in getting in and out of the hot stock of the day, week, month, or longer, inevitably buy at highs and follow the herd in panic selling in far too many cases.
There are some technical analysts who claim in a strange twist that the RSI can be used to buy high priced stocks, hold them for capital gains, and exit as the stock weakens.
Buy Low Sell High is the ultimate common sense approach to investing. The challenge of executing the strategy is determining how low is an appropriate entry point and how high is an appropriate exit point. Long term investors convinced finding the bottom of a solid company whose price is falling is irrelevant as over time the stock will rise. There are technical indicators, while not perfect market timers, do provide BUY and SELL points. Experts recommend using more than one technical indicator.