
The Upside and Downside of Actively Managed ETFs
Virtually all financial analysts and market experts advise investors that the key to lowering the risk of stock market investments is diversification. Companies diversify by expanding geographical markets and product offerings, with a variety of products appealing to multiple consumer and commercial segments.
Diversifying a stock portfolio also involves investing in companies that are geographically and product line diversified. This suggests companies that offer both consumer staples – essential in down economic conditions – and consumer discretionary products that can be postponed in tough times.
Diversification sounds great to most investors in theory, but in practice building a diversified portfolio of individual stocks require the kind of time and temperament some investors simply do not have. Add to that, the advice from some market studies on the extreme end of the spectrum that a diversified portfolio needs between 25 and 30 individual stocks.
Prior to 2001 Australian investors sought diversification through mutual funds. These funds were run by a team of professional expert investors who shaped the fund according to its targeted sector – dividend stocks, blue chips, small caps, emerging and developed markets.
A new fund offering trading like stocks, the ETF (Exchange Traded Fund) came to Australia in 2001 but these funds were not actively managed. Those funds began arriving on the ASX in 2012, with the BetaShares Australian Equities Bear Hedge Fund (ASX: BEAR,) with Hedge Fund in the title to indicate the fund is managed or hedged to minimize risk. As its name implies, the fund is negatively correlated with the ASX 200, attracting investors with bearish views looking to short the market.
Top Australian Brokers
- Pepperstone - Trading education - Read our review
- IC Markets - Experienced and highly regulated - Read our review
- eToro - Social and copy trading platform - Read our review
What Are Active ETFs?
An active ETF aims to outperform whatever benchmark index tracks the entirety of the holding in the fund target. An active ETF targeting the ASX 200 will be selective on the stocks within the index added to the fund holding based on the research and strategy of the professionals managing the fund. The holdings in an Active ETF are rebalanced quarterly to ensure the portfolio remains on track to outperform its benchmark index.
Not all Active ETFs are index dependent. Managers have the option to deviate from the index by changing sector allocations and market time trades of underlying investments in the fund to improve the odds of meeting the overall objectives of the fund.
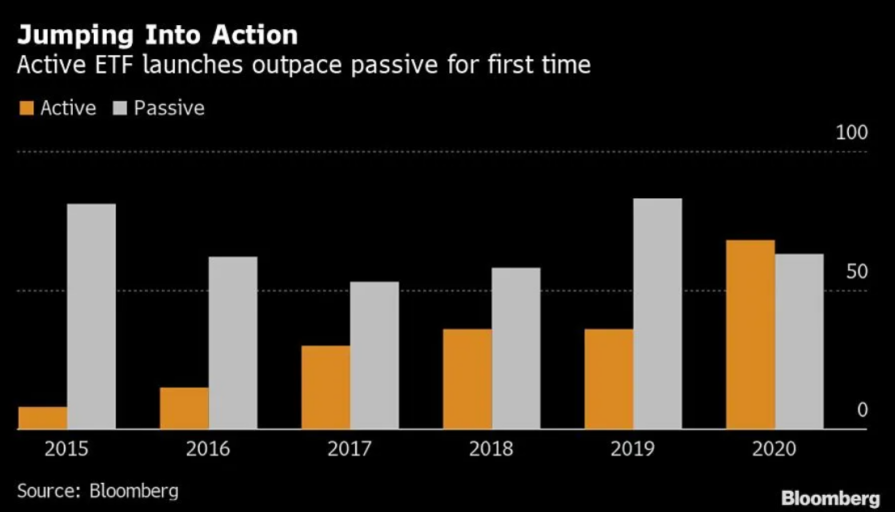
Passive ETFs dominated the industry, but Active ETF startups outpaced their passive counterparts for the first time in 2020, a trend that continues as investors seem to be challenging the belief that a fund investing in all stocks in an index can beat a fund free to select the best stocks in an index.
Active vs Passive ETFs
Passive ETFs are based on the Efficient Market Hypothesis (EMH), which implies that share markets are inherently efficient with stock prices reflecting all available information.
The theory posits that beating the market is not possible since information is absorbed into the market with asset prices moving up or down accordingly.
EMH proponents of the randomness of markets advised investors to look for passive funds that track an index since neither fundamental or technical analysis to find undervalued stocks or predict market trends.
The theory was and remains controversial when you consider legendary US investor Warren Buffet has consistently done what EMH claims is impossible – outperform the market.
Passive ETFs are universally recognized as cheaper to purchase than Active ETFs due to low management fees of administrative management of a passive ETF and a team of professionals researching and buying and selling the holdings of an actively managed ETF.
Both have no entry minimums and both trade like stocks, available to be bought and sold at any time the market is open.
In addition to cost, performance is another differentiating factor. Numerous studies have shown the majority of actively managed ETFs do not outperform either their benchmark index or their investment objectives. Reported performance for passive ETFs do not match the returns received by individual investors for two reasons. First the index is not charged fees as a passive ETF is and the second is how an individual invests. Those making multiple buys over time pay higher trading costs.
Active ETFs may be riding a wave of new investors who do not believe in efficient markets (as more and more analyst and experts have come to believe) and who look to the track record of Warren Buffet and another legendary US investor – Peter Lynch – for inspiration. Lynch actively managed the Fidelity Magellan Fund from 1977 to 1990 reaching an average annual return of an astounding 29.2% per year.
Finally, there is an issue of concern to Australian investors regarding the multiple studies pointing to sub-standard performance of a majority of actively managed ETFs. These studies cover US ETFs with a larger universe of stocks than the typical ETF on the ASX.
A ten year study from Morningstar US released in 2021 found that only 25% of all actively managed funds in the US beat their indices. However, the same study found better active management performance in smaller markets like small-cap to mid-cap companies and foreign markets.
For ASX investors this suggests sticking with passive funds to track the ASX 200 and blue chip companies, while seeking actively managed funds for small caps. BetaShares Small Cap Select Fund (SMLL) and State Street Global Advisers SPDR S&P ASX Small Ordinaries Fund (ASX: ISO) are examples of ETFs targeting ASX small caps. From BlackRock, the iShares Core S&P Small-Cap ETF (ASX: IJR) targets US small caps.
Active ETFs vs Mutual Funds
Active ETFs have lower management fees than most active mutual funds on the ASX and no minimum investment amount characteristic of actively managed mutual funds.
However, the major difference is the same regardless of active or passive management. All mutual funds – passive index and active management – can not be bought or sold during the normal trading day, although orders can be placed. At the close of the day, the fund value changes to reflect the daily price movements of the fund’s holdings, establishing the trade amount with the transaction settled in one to two days. Both passive and active ETFs trade like regular stocks, bought and sold at any time during the trading day.
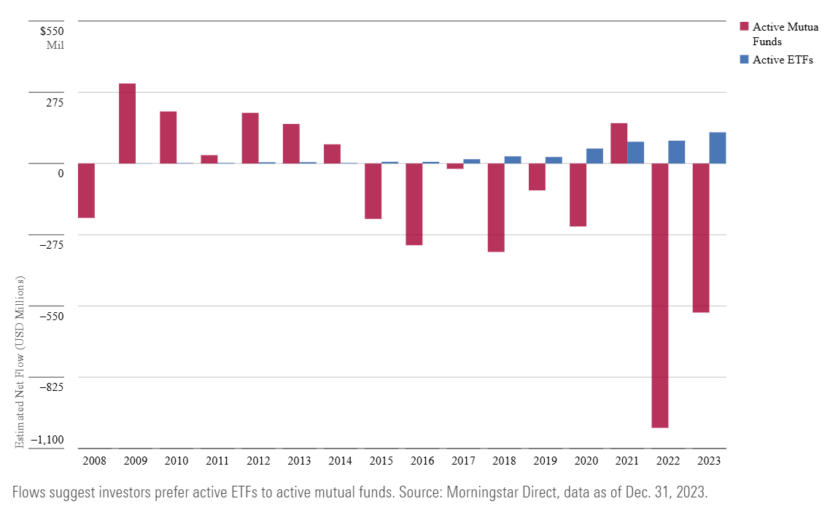
Investing dollars in Active ETFs are now outpacing fund flows into Active Mutual Funds.
In the early days of the introduction of exchange traded funds (ETFs) as a streamlined approach to creating a diversified portfolio of stocks, investors’ choices were limited to passive funds without professional management that tracked a benchmark index.
The later addition of actively managed ETFs with professional management researching and selecting best of breed stocks in order to outperform an index have gained in popularity.
Studies of US based ETFs repeatedly show underperformance of most active ETFs trying to outperform their benchmark index. However, a Morningstar study showed better performance from active ETFs targeting smaller markets.