John Athanasiou, Red Leaf Securities
BUY RECOMMENDATIONS
Bapcor (BAP)
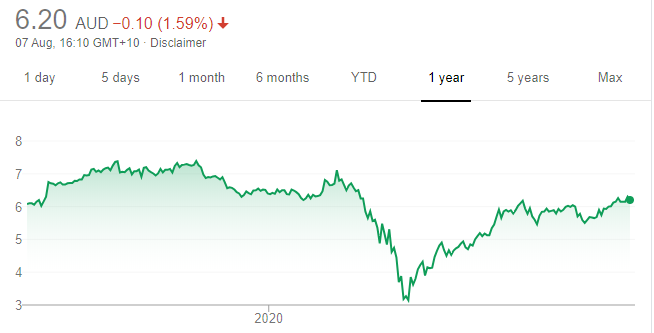
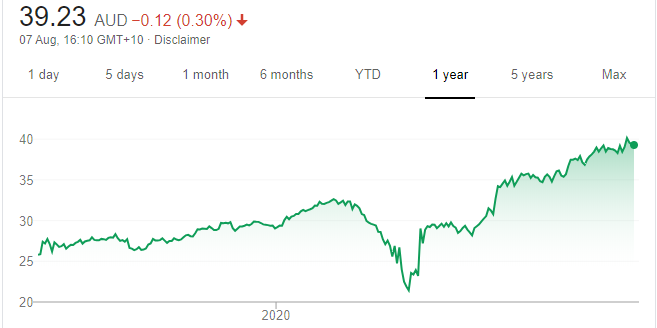
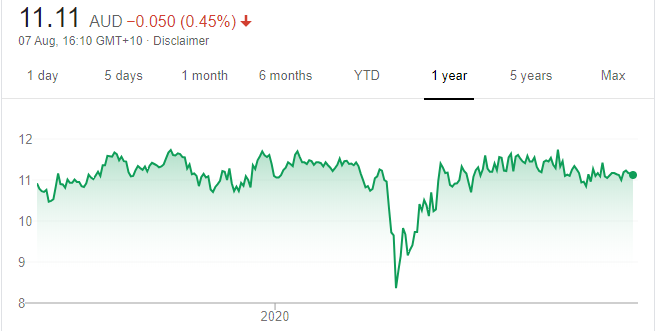
Chart: Share price over the year
This automotive aftermarket parts provider recently announced it had experienced stronger than anticipated demand in its retail and Burson Trade segments for the months of May and June. Autobarn same store sales increased by more than 45 per cent compared to the prior corresponding period. Same store sales at Burson Trade are expected to grow by about 10 per cent in May and June compared to the same period last year. We believe demand for auto parts will continue to remain robust.
Carsales.com (CAR)
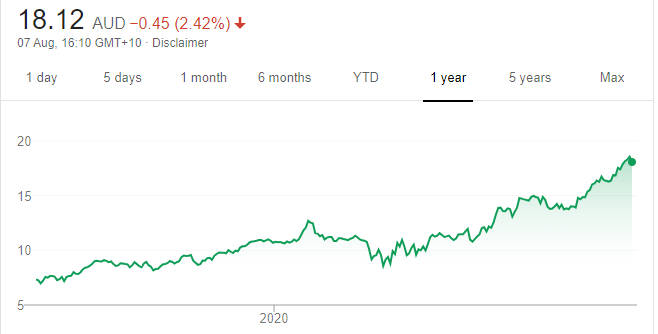
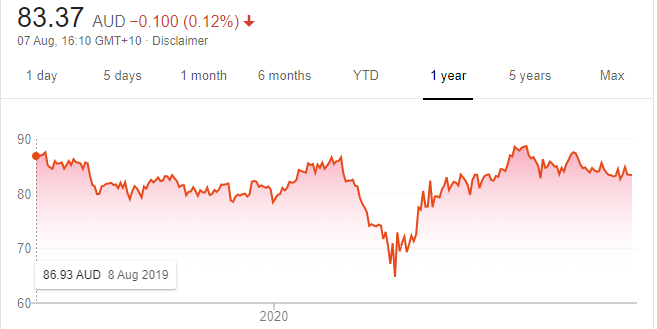
Chart: Share price over the year
The Federal Government increased the instant asset write-off threshold from $30,000 to $150,000 in a bid to stimulate the economy. This measure led to increasing new car sales in June. Carsales.com is an online leader and we expect increasing demand for vehicles to be reflected in its full year results on August 19.
HOLD RECOMMENDATIONS
EML Payments (EML)
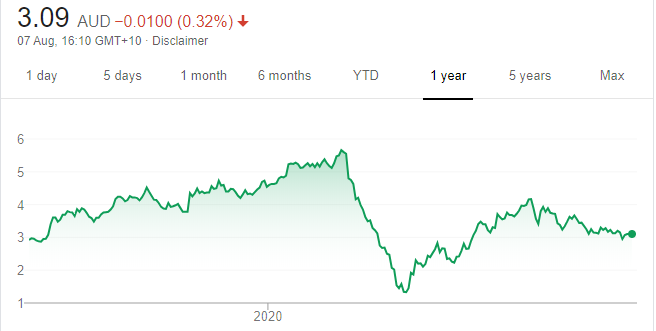
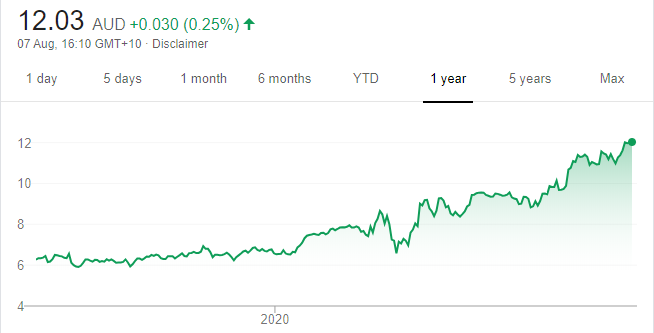
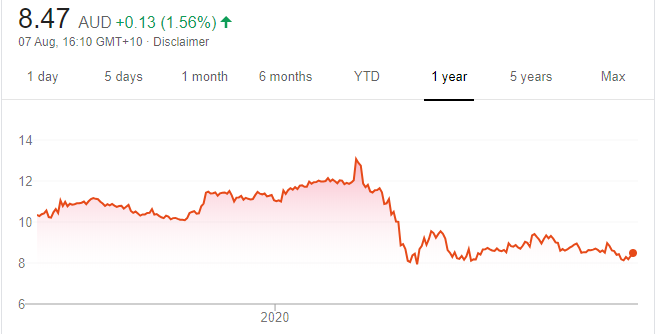
Chart: Share price over the year
This payment solutions provider has been a strong performer. The share price has risen from $1.335 on March 23 to close at $3.10 on August 6. The move towards a cashless economy continues to accelerate. We suggest investors continue holding the stock to see if the share price momentum continues.
Lynas Corporation (LYC)
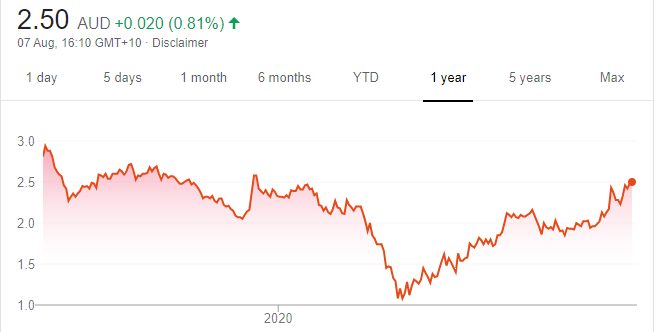
Chart: Share price over the year
This rare earths miner recently announced it had signed a contract with the US Department of Defence to undertake detailed planning and design work for the construction of a heavy rare earth separation facility. The share price rallied on the news. In our view, LYC is worth holding, particularly if construction of the US plant goes according to plan.
SELL RECOMMENDATIONS
Regis Healthcare (REG)
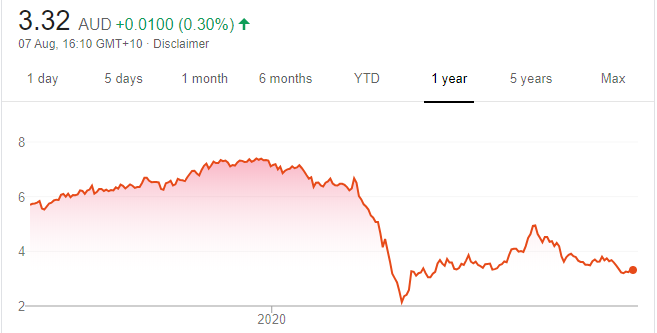
Chart: Share price over the year
The aged care sector has been materially impacted by COVID-19, particularly in Victoria, where Regis has exposure. The company withdrew fiscal year 2020 earnings guidance in April. In our view, it’s best to avoid listed companies in the aged care sector during these challenging times.
Qantas Airways (QAN)
Chart: Share price over the year
It’s still too early to invest in airline and tourism sector companies, in our view. State governments are tightening border restrictions again. International flights are the most profitable, but it’s uncertain when they will resume. While pandemic uncertainty remains, better opportunities exist elsewhere.
Top Australian Brokers
- Pepperstone - multi-asset Australian broker - Read our review
- eToro - market-leading social trading platform - Read our review
- IC Markets - experienced and highly regulated - Read our review
Chris Conway, Marcus Today
BUY RECOMMENDATIONS
Ansell (ANN)
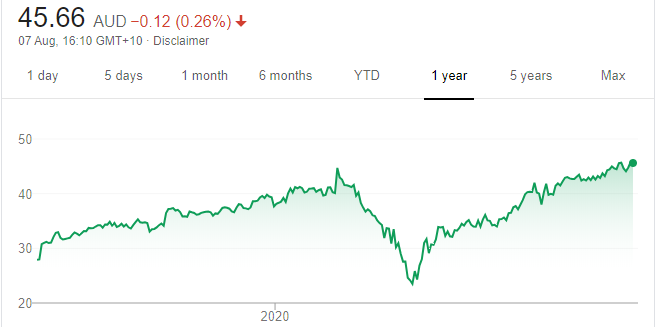
Chart: Share price over the year
Makes personal protective equipment. Strong demand for its premium products is likely to continue during and post the pandemic. Growth in its medical and industrial divisions paints a bright outlook. The shares have risen from $21.43 on March 23 to close at $39.95 on August 6.
Fortescue Metals Group (FMG)
Chart: Share price over the year
Demand for iron ore soared at a time when Brazilian mining giant Vale was struggling with production due to the COVID-19 crisis. The iron ore price responded by breaching a $US100 a tonne. This fattened up FMG’s margins. Chinese steel output is strong. The company’s track record of returning excess capital attracts investors.
HOLD RECOMMENDATIONS
JB Hi-Fi (JBH)
Chart: Share price over the year
This consumer electronics giant has a strong track record and is well managed. The company has benefited from increasing sales of home office products during the pandemic. In our view, the extension of fiscal stimulus provides a positive outlook. JBH recently guided that total sales in fiscal year 2020 would be about $7.86 billion.
NextDC (NXT)
Chart: Share price over the year
This data centre builder and provider is benefiting from accelerated demand in response to more people working from home during the pandemic. But we believe the spike in demand is part of a well established, longer term trend. Recent contract wins paint a bright outlook.
SELL RECOMMENDATIONS
AMP (AMP)
Chart: Share price over the year
A recent first half update was disappointing and reveals this financial services giant continues to underperform. The outlook remains challenging. The pandemic has impacted the pace of investment expenditure. In the absence of meaningful cost reductions, we still see no reason to own the stock at this time.
Unibail-Rodamco-Westfield (URW)
Chart: Share price over the year
Owns numerous shopping centres in Europe and the US. The first half result was impacted by the pandemic, as the company was forced to close shopping centres for a period of time from March. Adjusted recurring earnings per share fell 28 per cent. There’s too much uncertainty in the retail trading environment at this point.
Peter Day, Sequoia Wealth Management
BUY RECOMMENDATIONS
Newcrest Mining (NCM)
Chart: Share price over the year
The gold miner’s key asset Cadia exceeded the top end of its production range. Successful exploration is value accretive. NCM continues to benefit from a soaring gold price, which recently broke through $US2000 an ounce. The shares have continued to climb from a 52-week low of $20.70 on March 13 to close at $36.80 on August 6.
Telstra (TLS)
Chart: Share price over the year
Telstra management recently confirmed earnings guidance for the period to June 30, 2020. So it’s reasonable to expect the final dividend will be retained at 8 cents a share. If so, Telstra’s full year dividend would be 16 cents. We have fair value on Telstra at $4.40. I’m prepared to be overweight, as I would expect money to flow into Telstra if bank dividends remain under pressure. There’s still upside left in Telstra compared to its pre-COVID-19 highs. The stock finished at $3.39 on August 6.
HOLD RECOMMENDATIONS
AMP (AMP)
Chart: Share price over the year
It will take time for this financial services company to recover, and it will involve execution risk. While the stock appears to offer reasonable value, we remain concerned about downside earnings risks in the near term. We need to see more evidence of an AMP turnaround before we can be positive about the stock. The 12-month high was $2.09 on February 19. The shares closed at $1.445 on August 6.
APA Group (APA)
Chart: Share price over the year
We rate APA as one of the best stocks in the energy infrastructure space. It offers robust revenue streams and a solid balance sheet. The reliable distribution appeals to income oriented investors. However, we believe the stock is fully valued at current prices.
SELL RECOMMENDATIONS
ASX Limited (ASX)
Chart: Share price over the year
The ASX has delivered solid results in recent periods and remains a quality operator. ASX also continues to make significant investments, which have the potential to add future revenue streams in the longer term. However, given our ASX forecasts are for low to mid single digit earnings per share growth in the near term, we continue to see the ASX as expensive.
Coca-Cola Amatil (CCL)
Chart: Share price over the year
We’re forecasting a significant fall in first half earnings. Margin deterioration is a result of materially lower volumes, a switch to value packs, lower margin channels and a loss of scale in Indonesia. A key trading period that includes Easter, Anzac Day and Ramadan was impacted by lockdown measures.


