
Using the Relative Strength Index for Buy and Sell Signals
Investors overwhelmed by the host of technical indicators they find on most stock selection graphs available on trading platforms and financial websites might be surprised to learn in 1978, there were only two technical indicators in use.
Then came engineer turned real estate developer turned technical analyst, J. Welles Wilder. He devised and introduced the RSI and added four more technical indicators in his book New Concepts in Technical Trading Systems. Technical analysis must have had few believers in the financial press in 1978, as Wilder self-published his book, earning him the accolade of “one of the heroes of technical analysis.” Book sales numbered in the tens of thousands and the book is back in print, available on Amazon and elsewhere.
What is The Relative Strength Index (RSI) ?
The Relative Strength Index (RSI) was one of the new indicators Welles introduced, the first of many momentum indicators, or oscillators to follow.
An oscillator constructs high and low bands between two extreme values. Connecting the bands can show trend developing within the bands. In the short term the oscillator exceeding the highs and dropping below the lows represent potential overbought or oversold conditions.
Top Australian Brokers
- Pepperstone - Trading education - Read our review
- IC Markets - Experienced and highly regulated - Read our review
- eToro - Social and copy trading platform - Read our review
In its simplest form, an RSI above the upper threshold can mean the stock is overbought and due for a trend reversal, signaling investors to sell the stock. The RSI dipping below the lower threshold indicates the stock may be oversold and due for an upward trend reversal, signaling investors it may be time to buy the stock.
How to Trade with the RSI?
Investors can alter the RSI settings by time and threshold, with the standard time interval set at 14 days and the overbought high value set at 70 and the oversold low value set at 30.
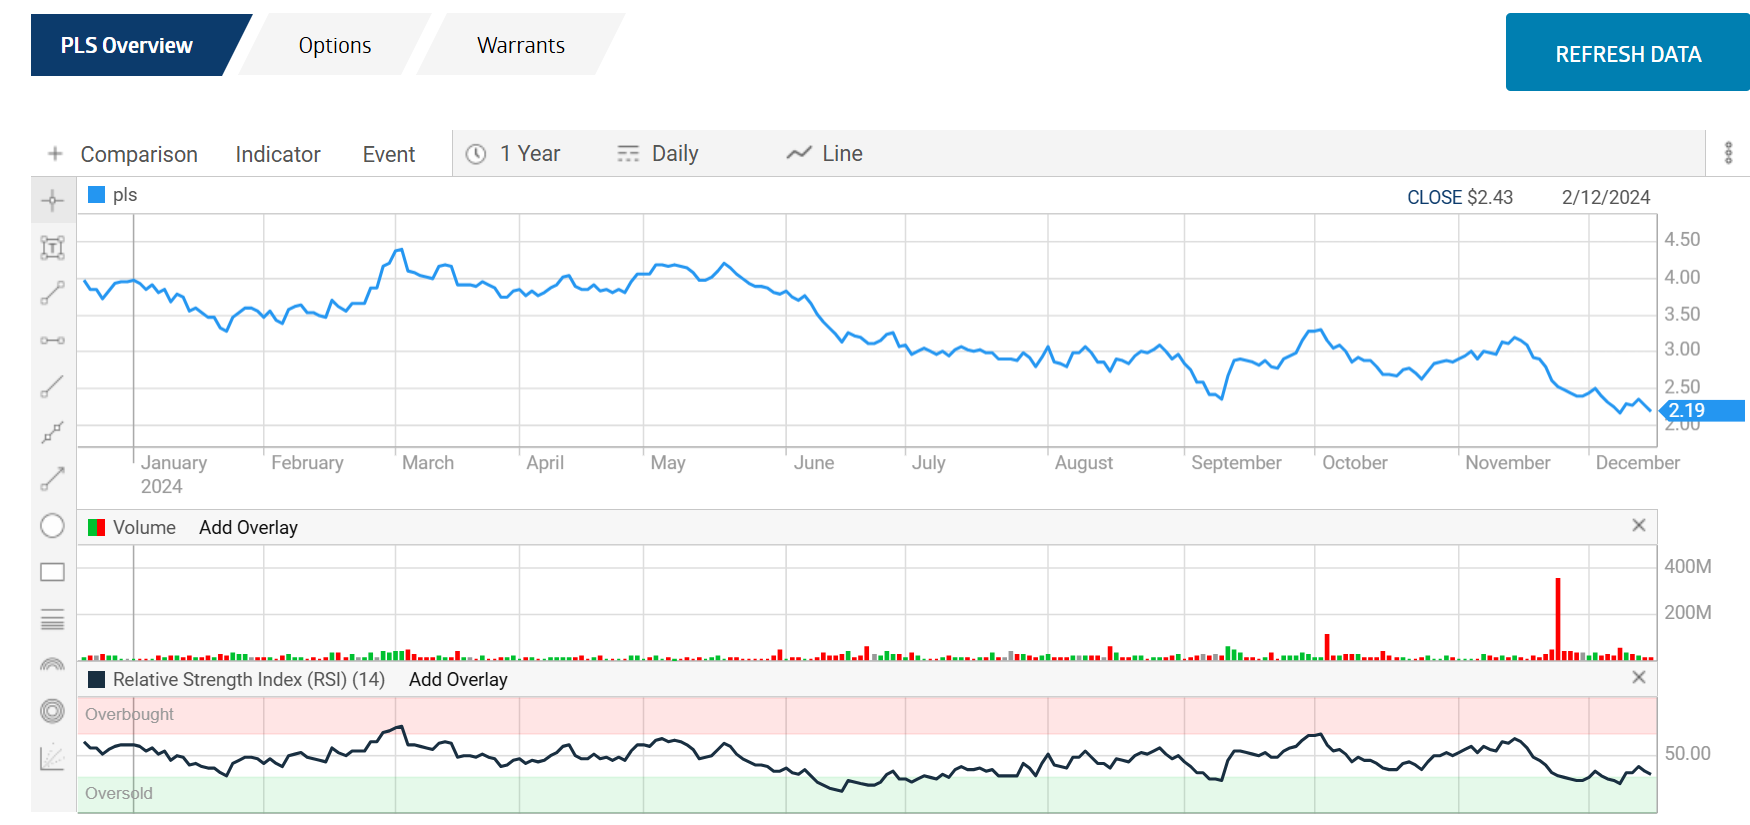
The following one year price movement chart for lithium mining company Pilbara Minerals (PLS) illustrates how to trade with the RSI.
The RSI identifies price movements that reach levels considered to be overbought or oversold. When stocks hit or closely approach the 70 level, the overbought condition suggests a price drop is imminent. This is a sell signal for short-term momentum traders and some long-term investors.
Long term investors may designate a portion of their PLS holdings as tradable. Along with the momentum traders, these investors would sell.
When the price movement hits the 30 level suggesting the stock is oversold and an uptick is coming, both the traders and the investors would buy in anticipation of the upward trend.
Studying the chart suggests in this case the RSI correctly identified overbought sell signals and oversold buy signals.
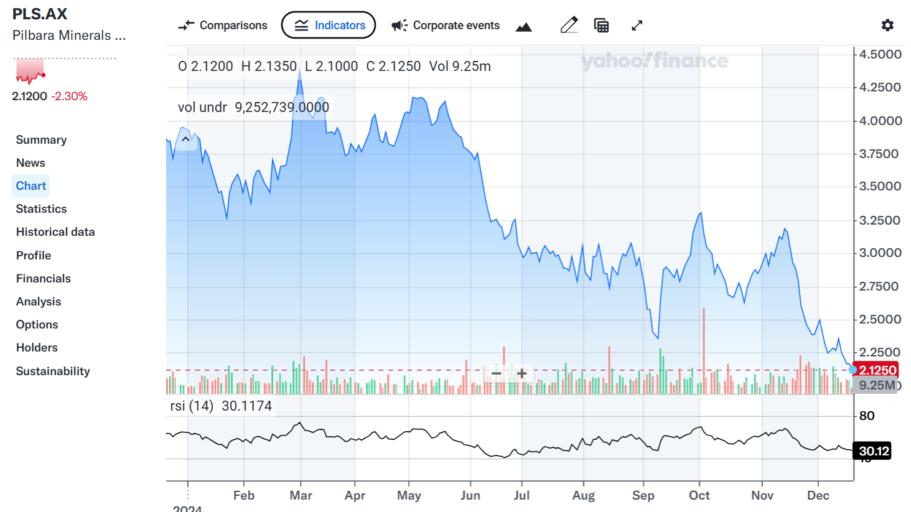
As is the case with many technical indicators, researchers jump in to point out the flaws in the indicator. As a result, some investors and traders alter the parameters for constructing the overbought and oversold conditions to 80 and 40 in Bull markets and 60 20 for Bear markets. Others opt for 80 20 in all conditions.
The charting software on yahoo finance Australia allows investors and traders to experiment with different overbought and oversold conditions. Here is a one year chart for Pilbara Minerals with the overbought level set at 80 and the oversold level at 20.
Many technical analysis experts recommend combining RSI with other indicators.
Combining the RSI with Other Indicators
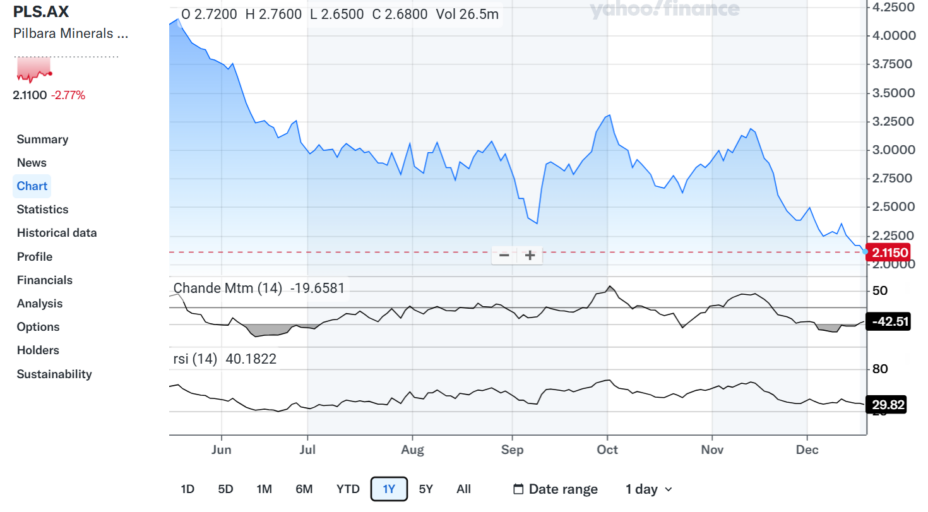
RSI proponents claim other indicators are necessary to validate the buy and sell signals generated by the RSI. Although it is not as popular as moving average indicators or the MACD (moving average convergence divergence), the Chande Momentum indicator seems useful, with overbought conditions set at 50 and oversold conditions at -5.
Here is the yahoo finance chart with both indicators.
Most technical analysis experts strongly recommend combining the RSI with the MACD.
Here is what that looks like on the Pilbara chart from yahoo finance.
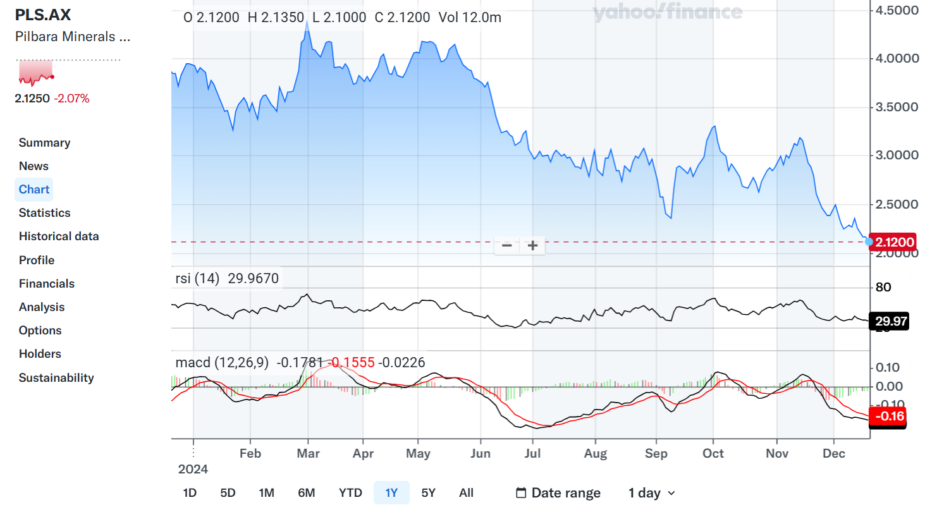
Like the RSI, the MACD aims to spot price trends. The indicator plots two separate exponential moving averages – the 26 day EMA is subtracted from the 12 day EMA. The result is called the MACD line with the final step in creating the indicator calculating a 9 day EMA called the signal line, plotted on top of the MACD line.
The convergence or divergence of the two lines can be used as BUY or SELL signals.
When the MACD line crosses above the signal line a BUY signal appears. When the MACD line crosses below the signal line, a SELL signal appears.
The Drawbacks of the RSI
Perhaps the greatest advantage of the RSI is its simplicity. But there are disadvantages of which both momentum traders and long-term investors should be aware.
Because of its simplicity investors and traders alike may be tempted to rely on the RSI without combining the RSII with other technical indicators.
Some technical analysis experts caution against making trading decisions based solely on the RSI and additional indicators, advising investors to rely on other buy/sell criteria consistent with their investing philosophies.
RSI signals occasionally lag behind price movements, remaining in overbought or oversold conditions while price trend reversals are coming on.
The RSI is prone to generating false signals in low liquidity or unexpected news events, both positive and negative.
Divergence and the RSI
The RSI “diverges” when the indicator moves in an opposite direction of the trending price.
Bullish divergence happens when the low prices contradict each with the RSI signalling a lower low than the actual price,
A Bearish divergence when the RSI signals a lower high than the actual price.
Among the vast array of technical indicators readily available for all investors to add to their investment decision making criteria, the Relative Strength Index is arguably the simplest to use and the easiest to comprehend.
The RSI tracks the price movement of a stock, identifying price levels marking the stock price as either overbought or oversold. A BUY signal appears when the price hits the threshold for oversold status with a SELL signal generated when the price hits the threshold for overbought status.
The parameters for oversold and overbought status can be set by investor preference. Technical analysis experts strongly encourage investors and traders to use the RSI in conjunction with other technical indicators.