John Athanasiou, Red Leaf Securities
BUY RECOMMENDATIONS
Ansell (ANN)
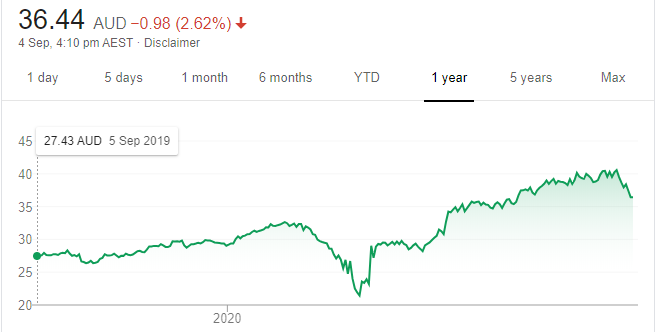
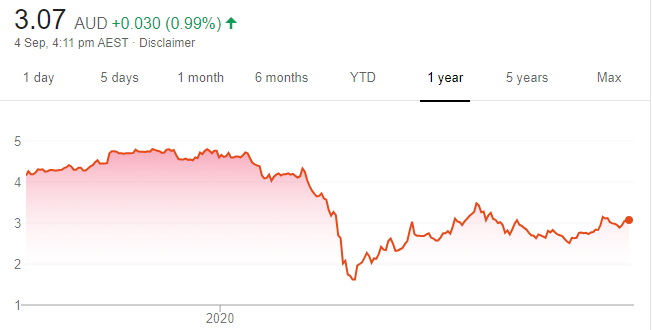
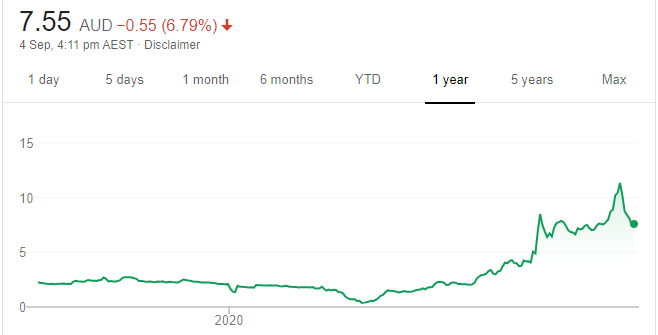
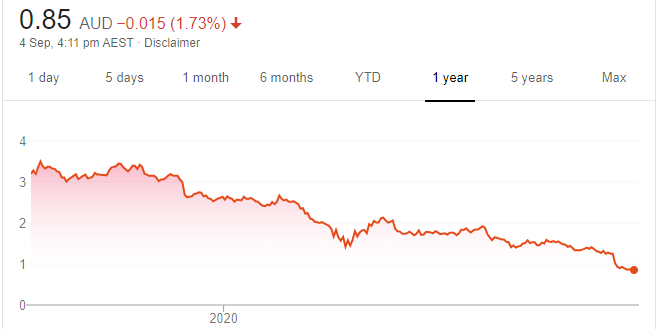
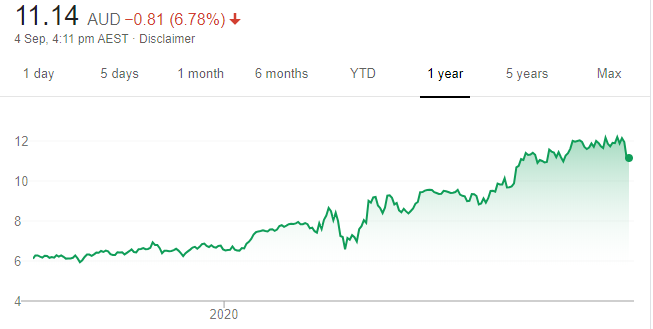
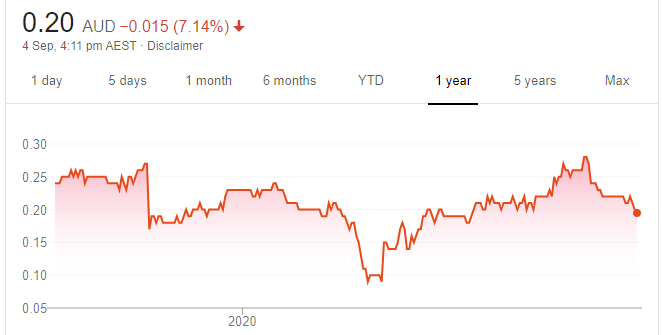
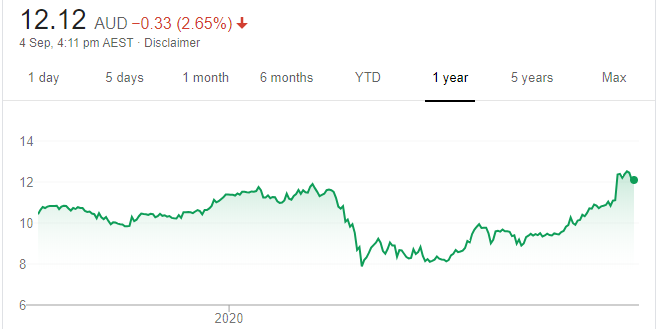
Chart: Share price over the year
Ansell makes personal protective equipment. Sales grew by 7.7 per cent to $US1.613 billion in fiscal year 2020. The company reported a 42.1 per cent increase in statutory net profit to $US158.7 million. We expect strong demand for Ansell products to continue due to COVID-19. ANN declared a final dividend of US28.25 cents. The company is positioned to grow in fiscal year 2021.
EML Payments (EML)
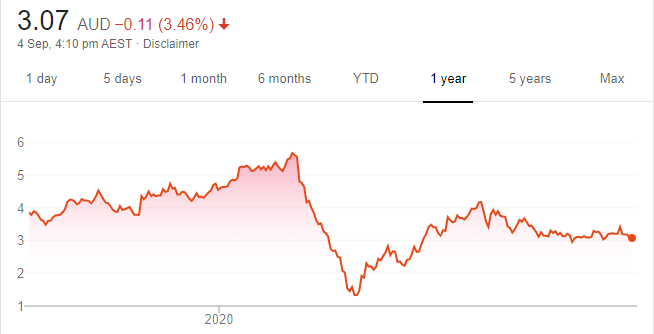
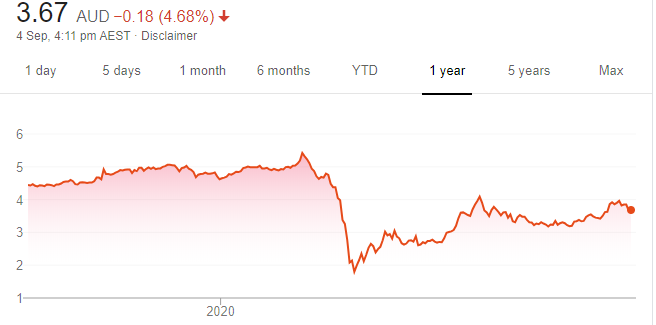
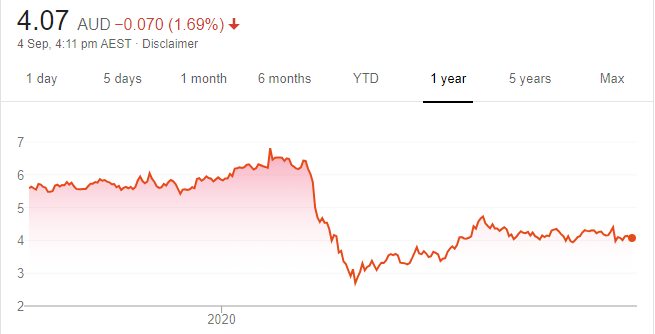
Chart: Share price over the year
We have upgraded this payment solutions provider to a buy. The company increased revenue by 25 per cent to $121.6 million in fiscal year 2020. It posted a 10 per cent increase in underlying EBITDA to $32.5 million. EML has improved its online sales presence and, as a result, has the potential to scale up rapidly.
HOLD RECOMMENDATIONS
Carsales.com (CAR)
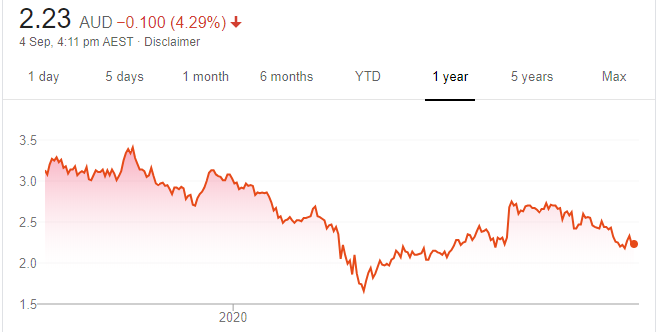
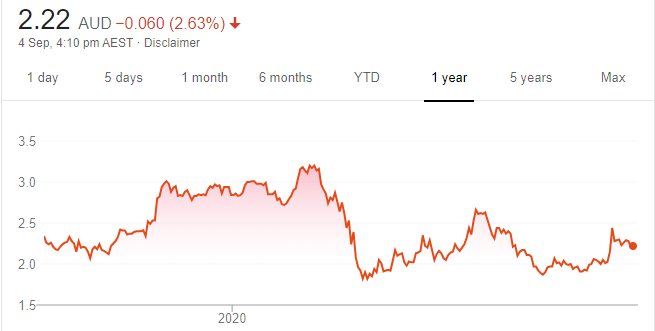
Chart: Share price over the year
We have moved from a buy recommendation to a hold, as consumers are wary about spending on big ticket items. The Federal Government’s instant asset write-off boosted vehicle sales. But, we believe, the stimulus measure has been priced into CAR’s share price. The shares have continued to climb in fiscal year 2021, so keep an eye on the trend.
Xero (XRO)
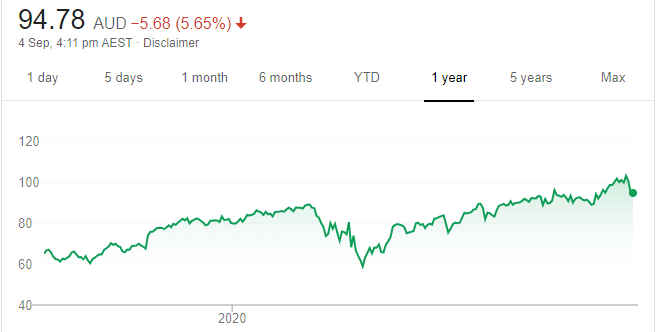
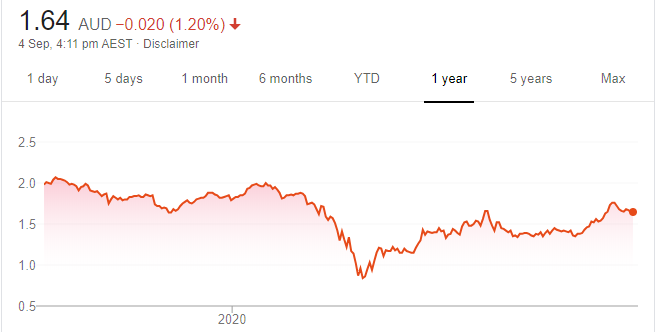
Chart: Share price over the year
This cloud based accounting software business lifted operating revenue by 30 per cent to $NZ718.2 million in its latest full year result. The total number of subscribers grew by 26 per cent to 2.285 million. The shares have risen from $90.80 on July 1 to finish at $100.46 on September 3.
SELL RECOMMENDATIONS
Domino’s Pizza Enterprises (DMP)
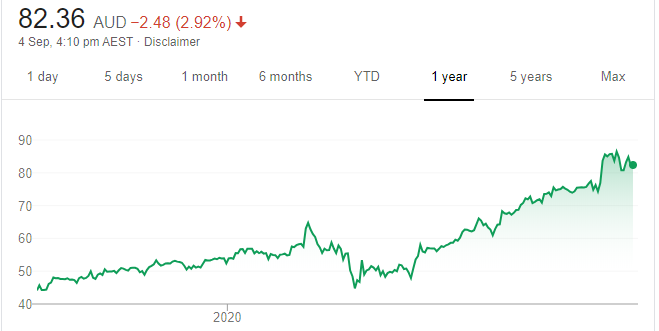
Chart: Share price over the year
DMP has benefited from lockdowns across the globe. Online sales were up 21.4 per cent to $2.36 billion in fiscal year 2020. Japan reported a strong performance, with sales increasing 25.9 per cent. The shares have risen from $70.20 on July 1 to close at $84.84 on September 3. We believe the stock is now overvalued, so investors may want to consider taking a profit.
The Star Entertainment Group (SGR)
Chart: Share price over the year
The pandemic has severely impacted the casino industry and we believe this Sydney, Brisbane and Gold Coast operator will continue to face challenges amid tight health and travel restrictions. Until governments can provide more clarity on the easing or removal of travel restrictions, we prefer other investments.
Top Australian Brokers
- Pepperstone - multi-asset Australian broker - Read our review
- eToro - market-leading social trading platform - Read our review
- IC Markets - experienced and highly regulated - Read our review
Angus Geddes, Fat Prophets
BUY RECOMMENDATIONS
Stockland (SGP)
Chart: Share price over the year
The diversified property group reported a statutory loss of $14 million in fiscal year 2020. The loss includes COVID-19 impacted net devaluations in commercial property and a net fair value decline in retirement living. However, we’re optimistic about Stockland’s exposure to residential house and land sales. We expect Australia to follow a similar pandemic-induced trend in the US, where people are increasingly moving out of apartments and into single storey family homes.
Western Areas (WSA)
Chart: Share price over the year
The nickel producer delivered an impressive fiscal year 2020 result. It posted a 123 per cent increase in net profit after tax to $31.9 million, driven by firmer nickel prices and lower costs. EBITDA rose 51 per cent to $121.9 million. EBITDA margins surged from 30 per cent to 39 per cent. I believe WSA will continue to outperform on higher nickel prices, driven by the electric vehicle market. WSA’s long-life Odysseus project is a top asset.
HOLD RECOMMENDATIONS
Domino’s Pizza Enterprises (DMP)
Chart: Share price over the year
Global network sales grew 12.8 per cent to $3.27 billion in fiscal year 2020. Online sales surged 21.4 per cent to $2.36 billion following investment in its online ordering platform. Significant digital investment has positioned the company well for its delivery and takeaway channels. A shift towards online purchasing has been accelerated by the pandemic.
Nine Entertainment Co. Holdings (NEC)
Chart: Share price over the year
The share price moved higher in August despite the pandemic impacting advertising revenues in its latest result. Nine reported a loss of $575 million in fiscal year 2020. The loss included a post tax specific item cost of $665 million, mostly relating to impairment of goodwill. However, Nine’s digital businesses have remained resilient. Streaming service Stan has outperformed on the back of rapid subscriber growth during lockdowns.
SELL RECOMMENDATIONS
Sezzle Inc. (SZL)
Chart: Share price over the year
The buy now, pay later sector recently came under pressure after payments giant PayPal unveiled plans to launch a competing product in the US. PayPal has a massive scale advantage to disrupt and win market share from many smaller firms in the sector. PayPal has 26 million merchants and 324 million users. PayPal’s existing technology can quickly introduce the offering. US focused operators, such as Sezzle, will face fierce competition from PayPal.
Whitehaven Coal (WHC)
Chart: Share price over the year
Underlying net profit after tax fell 95 per cent to $30 million in fiscal year 2020. Falling coal prices contributed to the disappointing result. As to the Vickery mine in New South Wales, the company remains cautious about expansion and capital allocation given short term economic uncertainty. I would rather back the iron ore story than coal.
Disclosure: Interests associated with Fat Prophets hold shares in SGP, WSA, DMP and NEC.
Jabin Hallihan, Morgans
BUY RECOMMENDATIONS
NextDC (NXT)
Chart: Share price over the year
This data centre builder and provider generated a 23 per cent increase in underlying EBITDA to $104.6 million for fiscal year 2020. Based on work in progress, underlying EBITDA could exceed $200 million in the next four years. NXT offers a high quality business model and earnings streams. The strong trend of outsourcing cloud data solutions paints a bright outlook for NXT.
Genex Power (GNX)
Chart: Share price over the year
GNX is a power generation development company, focusing on clean energy and electricity storage solutions. The company has a strong balance sheet, with $65 million in cash. GNX is progressing towards completing and monetising its key hydro and solar projects. We expect increasing earnings and cash flow as more projects start operating.
HOLD RECOMMENDATIONS
Bega Cheese (BGA)
Chart: Share price over the year
The company’s recent full year result was above our forecast and we view this as a solid outcome in light of drought, bushfires and COVID-19. Strong cash flow generation enabled BGA to make good progress on reducing its gearing metrics. The company is now trading in line with our valuation, so we retain a hold rating.
Reece (REH)
Chart: Share price over the year
Most of the company’s plumbing, bathroom and allied operations have continued trading during the pandemic. Full year sales revenue increased 10 per cent to $6.010 billion and net profit after tax rose 19 per cent to $240 million. Margins declined 70 basis points to 8.9 per cent. The full year dividend of 12 cents a share beat consensus estimates of 8.8 cents a share.
SELL RECOMMENDATIONS
Link Administration Holdings (LNK)
Chart: Share price over the year
This share registry and administration company posted a 12 per cent fall in statutory revenue on the prior year to $1.23 billion. An impairment of $108 million was largely behind a statutory net loss after tax of $114 million. We expect margins on cash to be pressured in a low interest rate environment. It may be prudent to consider selling the stock, as we believe it may take time for interest rates to move higher and generate long term value.
Bingo Industries (BIN)
Chart: Share price over the year
We believe there’s potential downside risk to earnings in this waste management company during the next 12 months. This is because we see a softer construction sector, particularly in Sydney and Melbourne. A weaker sector is likely to keep a lid on the company’s earnings potential. BIN looks expensive on our forecasts, recently trading on a multiple of about 50 times 2021 forecast earnings.


