

Michael Gable, Fairmont Equities
BUY RECOMMENDATIONS
Lynas Corporation (LYC)
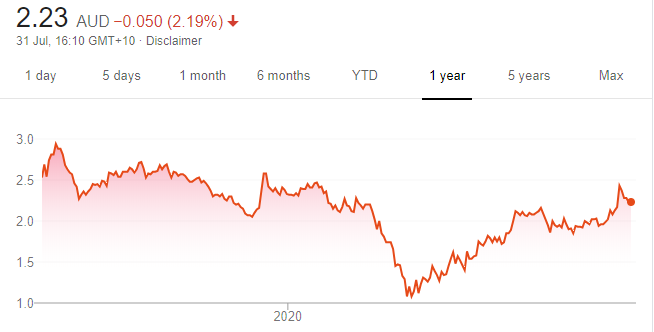
Chart: Share price over the year
The rare earths producer recently made a significant technical breakout by breaching the downtrend line that had been in place during the past year. LYC should rally higher from here, and we expect it to re-test last year’s high near $3. The shares finished at $2.28 on July 30.
Santos (STO)
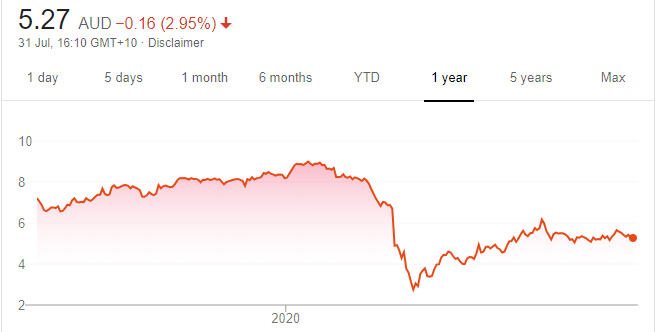
Chart: Share price over the year
Second quarter production of 20.6 million barrels of oil equivalent was 15 per cent higher than the prior quarter. Shares in this oil and gas company found solid support near $5. We’re confident a low is in place and expect the share price to move beyond $6. The shares closed at $5.43 on July 30.
HOLD RECOMMENDATIONS
BHP Group (BHP)
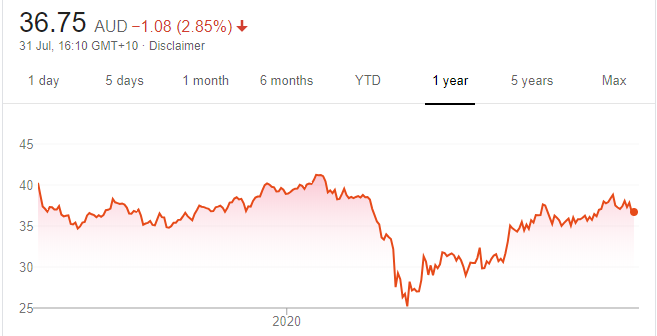
Chart: Share price over the year
Commodities should continue to do well on the back of a weaker US dollar. The BHP share price looks well supported on the chart and the uptrend remains strong. We expect the share price of this global miner to continue moving higher and be back above $40 by the end of the year. The shares finished at $37.83 on July 30.
Macquarie Group (MQG)
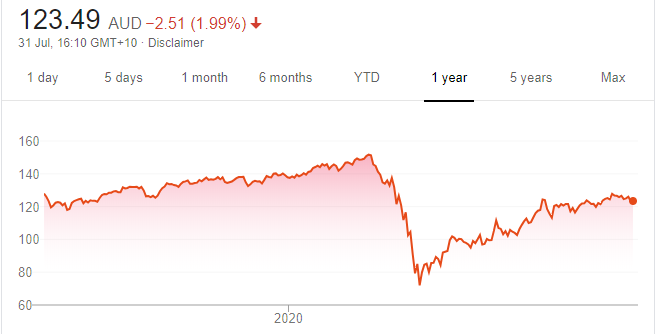
Chart: Share price over the year
The shares continue to march higher on the back of improving equity markets. The uptrend since the March lows appears sustainable, as any price dips are quickly bought. We expect the shares to reach $140 within the next few months. The stock closed at $126 on July 30.
SELL RECOMMENDATIONS
Suncorp Group (SUN)
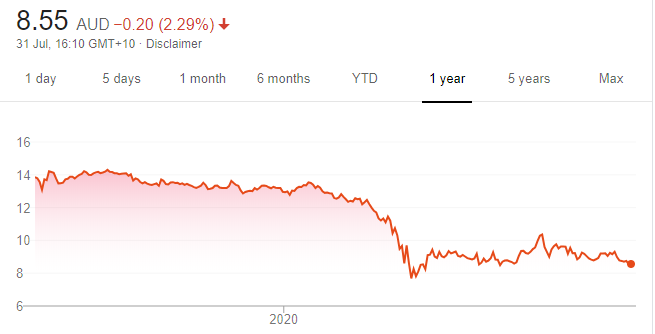
Chart: Share price over the year
The share price has been struggling to gain traction. The company is introducing a new business model to drive improvements in the banking and insurance sectors. But, from a technical perspective, the shares continue to look weak and we believe they are likely to head lower and underperform other financial stocks.
Brambles (BXB)
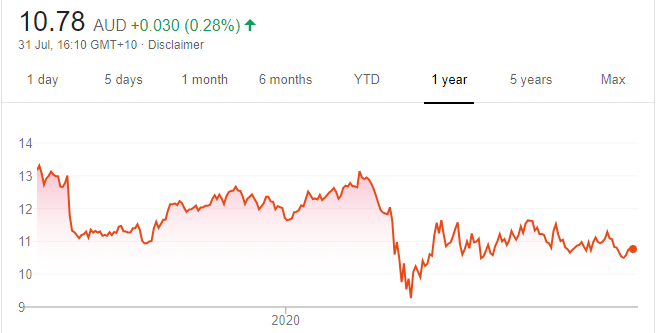
Chart: Share price over the year
The share price of this supply chain logistics company recorded a 52-week high of $13.42 on February 17. The shares were priced at $11.63 on June 1. The stock finished at $10.75 on July 30. On our assessment, the technical chart appears negative and the risk remains to the downside until a clearer picture emerges about its outlook in a COVID-19 world.
Top Australian Brokers
- Pepperstone - multi-asset Australian broker - Read our review
- eToro - market-leading social trading platform - Read our review
- IC Markets - experienced and highly regulated - Read our review

Angus Geddes, Fat Prophets
BUY RECOMMENDATIONS
Praemium (PPS)
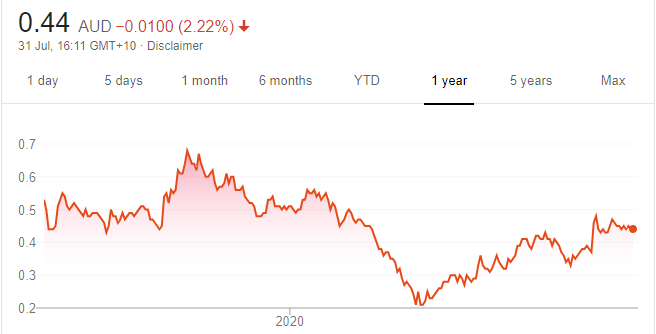
Chart: Share price over the year
This financial services platform provider is planning to acquire rival Powerwrap for $55.6 million. The integration will need to be executed, but a combined entity will generate a targeted $6 million in cost synergies and scale benefits in a fragmented industry. A deal will take the combined group’s funds under administration to around $27 billion – not far behind Netwealth, the largest independent specialist platform provider.
Mincor Resources NL (MCR)
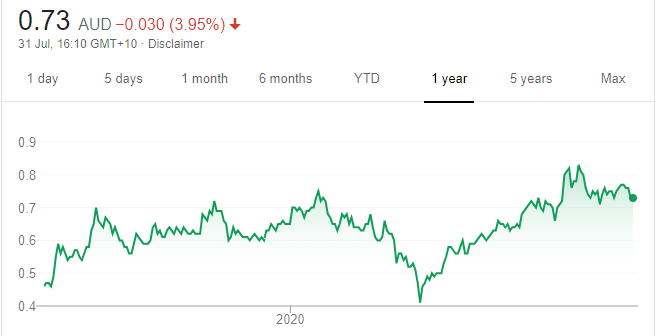
Chart: Share price over the year
Recently, this nickel company successfully raised $60 million to develop the Kambalda project and to accelerate regional exploration. A 16 per cent increase in the Cassini mineral resource to 58,700 tonnes of nickel was also well received by the market. A global infrastructure investment rollout and an auto industry rapidly shifting its focus towards producing electric cars remain key tailwinds for nickel.
HOLD RECOMMENDATIONS
Evolution Mining (EVN)
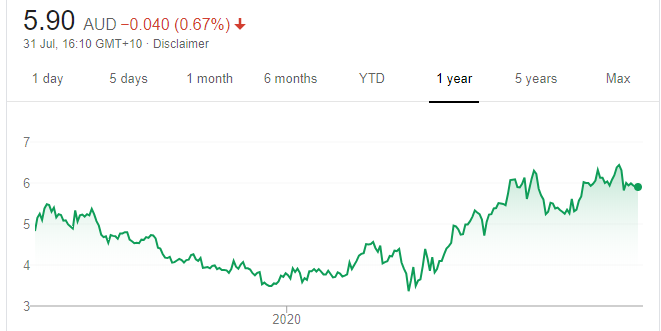
Chart: Share price over the year
I recommended this gold miner as a buy in The Bull.com.au in mid May. The shares have performed strongly, boosted by a record gold price. EVN had a strong June quarter, with operating cash flow of more than $320 million. Further growth is also in the pipeline with a maiden underground ore reserve at the Cowal mine. Management is also transforming the high grade, long life Red Lake mine in Canada.
Saracen Mineral Holdings (SAR)

Chart: Share price over the year
The share price has hit record levels on a surging gold price. The gold producer expects net profit after tax of between $190 million and $200 million for the 2020 financial year ended June 30, adjusted for Super Pit acquisition costs. All in sustaining costs of $A1101 an ounce in financial year 2020 leave attractive margins at current gold prices. SAR has reaffirmed 2021 production guidance of 600,000 ounces or more.
SELL RECOMMENDATIONS
Suncorp Group (SUN)
Chart: Share price over the year
The stock has underperformed since its pandemic lows, in our view. The company has put a new operating model and leadership structure in place to drive improvements in its core insurance and banking divisions. In our view, a sale of the banking division hasn’t been ruled out. SUN is also accelerating its digital and data driven transformation. However, it could take time before we see results. We believe better opportunities exist elsewhere. The shares finished at $8.75 on July 30.
National Australia Bank (NAB)

Chart: Share price over the year
The NAB strengthened its balance sheet with a capital raising earlier this year. NAB made a provision of $807 million to cover potential COVID-19 losses. We’re concerned about the potential COVID-19 impact on its small business lending portfolio, which is relatively larger than other banks. The stock lacks yield appeal in the near term.

Jabin Hallihan, Morgans
BUY RECOMMENDATIONS
Karoon Energy (KAR)
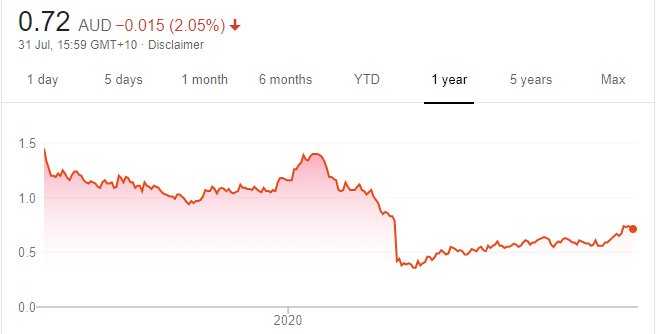
Chart: Share price over the year
The company has successfully revised its agreement with Petrobras to acquire the Bauna oil field in Brazil. We believe KAR has struck favourable terms, as cash flow from January 1, 2019 will be deducted from the purchase price. Also, contingent instalment payments are linked to the oil price until 2026. The terms significantly de-risk the transaction and underpin our $1.50 share price target. The shares closed at 73 cents on July 30.
Western Areas (WSA)
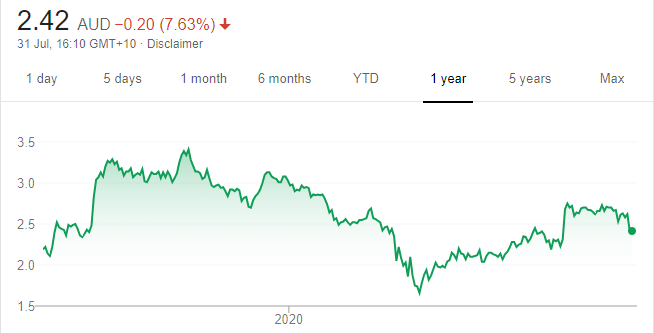
Chart: Share price over the year
Demand for nickel appears to be trending up, as it’s a key metal in batteries used in electric vehicles. The price of nickel has risen from about $US5 a pound in March to more than $US6 a pound in late July. Nickel was trading at recent highs of $US8 a pound last October, so there’s room for improvement. Our valuation is $3.23 a share. This nickel stock finished at $2.62 on July 30.
HOLD RECOMMENDATIONS
Nanosonics (NAN)
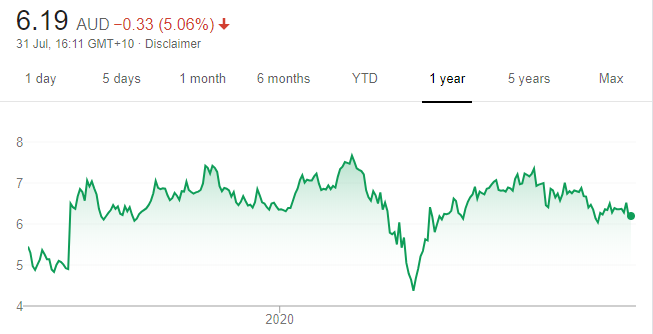
Chart: Share price over the year
We expect NAN’S highly prized infection control and decontamination technology platform to remain a core component of hospital processes in a post COVID-19 world. This underpins our earnings growth forecast of 75 per cent during the next 12 months. Nanosonics has a strong cash position. The shares closed at $6.52 on July 30.
BHP Group (BHP)
Chart: Share price over the year
The global miner has a strong balance sheet and we expect it to retain a strong dividend in fiscal year 2021. Iron ore was recently trading at $US110 a tonne, so BHP has high levels of free cash flow to underpin a forecast grossed up dividend yield of 4.5 per cent. We advise investors to consider holding BHP for an upcoming dividend in early September.
SELL RECOMMENDATIONS
Oil Search (OSH)
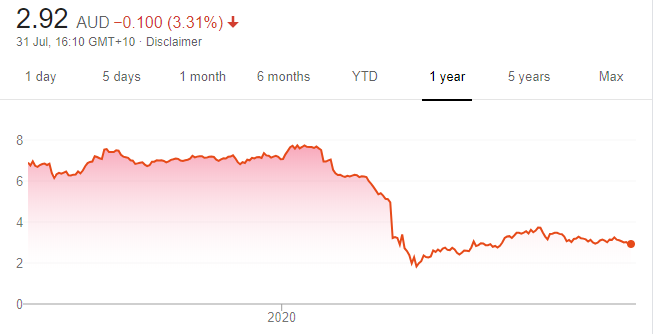
Chart: Share price over the year
LNG expansion plans in Papua New Guinea are likely to proceed. But, we believe, OSH will possibly have to sweeten financial terms with the PNG Government to get the deal done. Uncertainty remains as to when a possible agreement may be reached. Also, the low energy price is impacting existing LNG operations. Our share price target is $2.80. The shares closed at $3.02 on July 30.
Fortescue Metals Group (FMG)
Chart: Share price over the year
The iron ore producer shipped a record 47.3 million tonnes in the fourth quarter and 178.2 million tonnes for fiscal year 2020. An increasing iron ore price has contributed to the shares rising from $10.35 on April 1 to finish at $17.55 on July 30. We believe the shares are priced to perfection and leave no room for error. We value the shares at $11.50. It may be prudent to consider taking some profits.
The above recommendations are general advice and don’t take into account any individual’s objectives, financial situation or needs. Investors are advised to seek their own professional advice before investing.
Please note that TheBull.com.au simply publishes broker recommendations on this page. The publication of these recommendations does not in any way constitute a recommendation on the part of TheBull.com.au. You should seek professional advice before making any investment decisions.