
See our brand new top 10 broker reviews. Find your perfect platform!

John Athanasiou, Red Leaf Securities
BUY RECOMMENDATIONS
Ahalife Holdings (AHL)
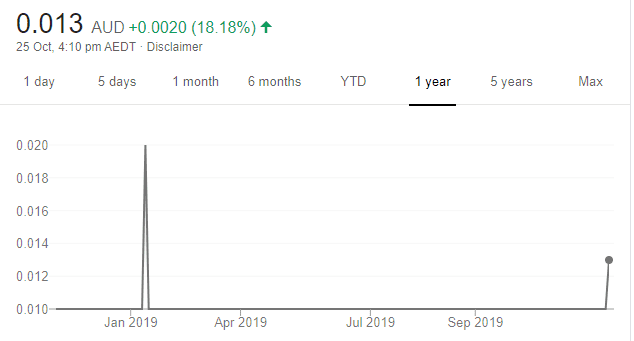
Chart: Share price over the year
Owns and operates multiple e-commerce platforms for lifestyle and design products. AHL is one of our preferred speculative investments following the company’s recent acquisition of Design Milk, which has about 3 million followers on Instagram. The Design Milk website has gone live, so even if it generates a small percentage of sales from followers, we expect AHL to be re-rated going forward. The shares were trading at 0.013 cents on October 25.
Vortiv (VOR)
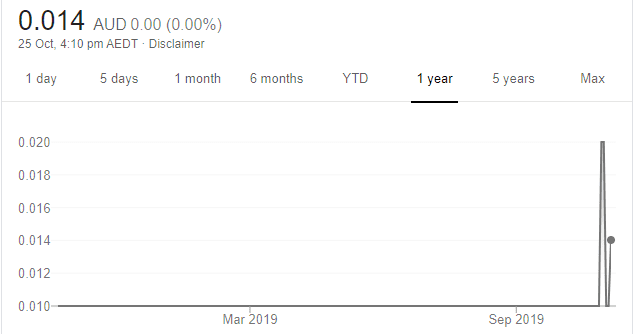
Chart: Share price over the year
Formerly known as Transaction Solutions International, the company focuses on cyber security and cloud infrastructure and security. In our view, the company is performing well and we expect it to continue. The company has successfully grown via acquisitions and is on track to meet its forecasts. If the forecast numbers are met, we expect VOR will be on the radar of investors. A speculative buy.
HOLD RECOMMENDATIONS
Breville Group (BRG)
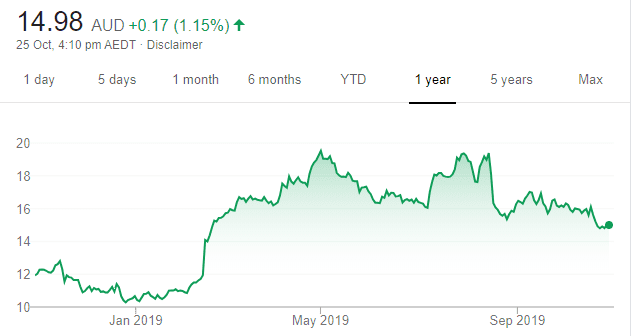
Chart: Share price over the year
The share price of this kitchenware maker has performed well in the past year. However, we’re concerned about cautious shopper spending following recent weak consumer sentiment data. Given this tough environment, we’re waiting on BRG numbers before we increase or decrease our positions in the company.
Webjet (WEB)
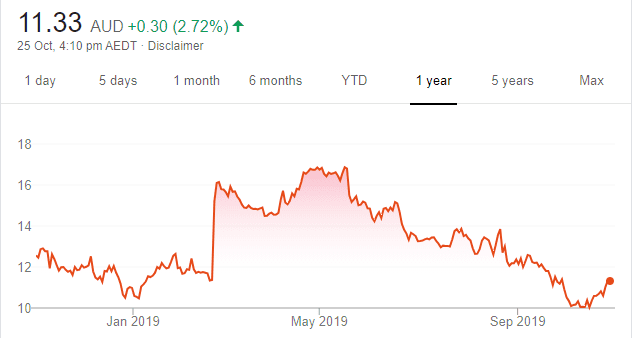
Chart: Share price over the year
In September, this online travel agency acknowledged that the collapse of UK based Thomas Cook will have an impact on fiscal year 2020 results. It’s been factored into the share price, as has weaker consumer confidence. But we don’t see any near term catalyst for a re-rating. In light of this, we feel there’s no need to reduce exposure, or rush into buy Webjet.
SELL RECOMMENDATIONS
Afterpay Touch Group (APT)
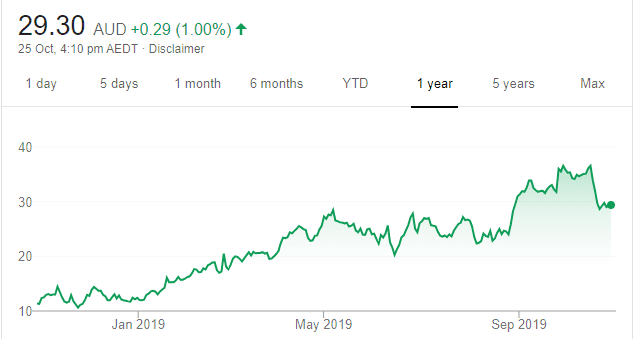
Chart: Share price over the year
Shares in this market darling were recently smashed after an investment bank research report suggested they were way over-valued. I have moved from a hold to a sell following negative sentiment towards the buy now, pay later sector. In my view, it will take time for sentiment to change. The share price of this buy now, pay later company has fallen from $37.41 on October 15 to trade at $29.575 on October 25.
WiseTech Global (WTC)
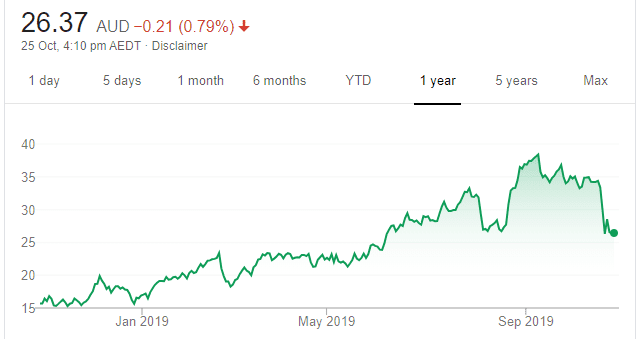
Chart: Share price over the year
Top Australian Brokers
- Pepperstone - multi-asset Australian broker - Read our review
- eToro - market-leading social trading platform - Read our review
- IC Markets - experienced and highly regulated - Read our review
This logistics software provider has strongly rejected claims of financial impropriety and irregularity raised in a report by short seller J Capital Research. In our view, it’s best to be on the sidelines at this point. Wait until a clearer picture emerges about the outlook. The 52 week low was $14.88 on November 13 last year. The shares were trading at $26.09 on October 25. Investors can consider taking profits.

Michael Gable, Fairmont Equities
BUY RECOMMENDATIONS
Nearmap (NEA)
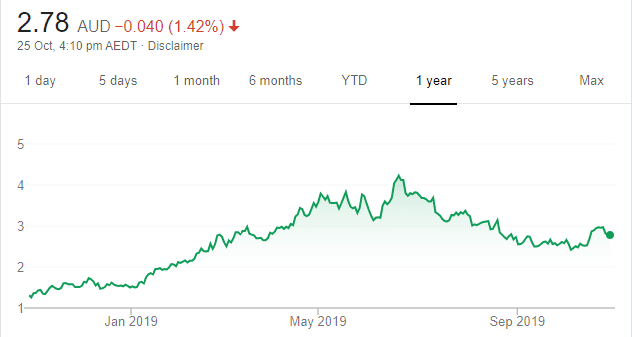
Chart: Share price over the year
This aerial imagery company staged a breakout in mid October, indicating the downtrend was finished and triggering a buy signal on the chart. Volumes have been healthy on the way up. Based on recent trading, we expect a recovery in the share price beyond the mid $3 range during the next several weeks. The shares were trading at $2.92 on October 24.
Cleanaway Waste Management (CWY)
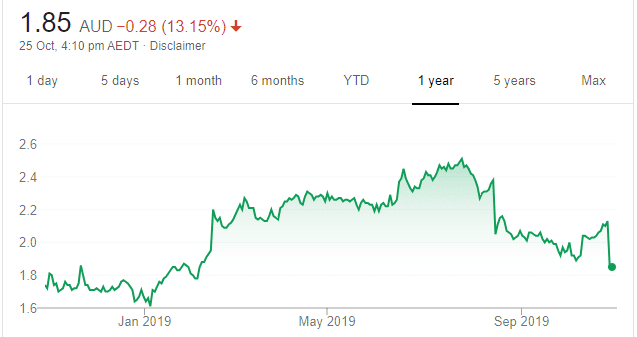
Chart: Share price over the year
CWY is a defensive stock with reliable earnings. The share price has been recovering following the acquisition of SKM Recycling and a broker upgrade. CWY has recently found good support on the chart and the share price looks set to move higher from here. The stock was trading at $2.14 on October 24.
HOLD RECOMMENDATIONS
Nanosonics (NAN)
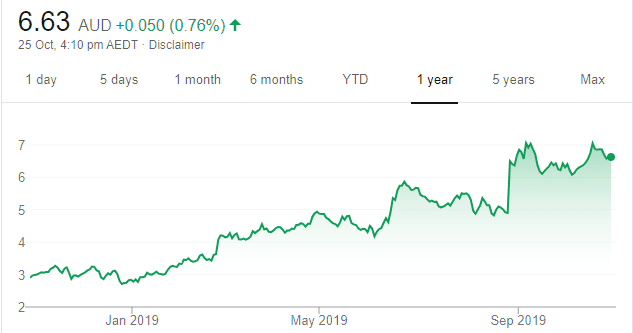
Chart: Share price over the year
This company specialises in preventing infection. It’s a stock we have traded successfully in the past. Most recently, it found good support near $6 and this triggered another buy signal. It continues to trend well. After making another new high, we expect it to establish a new baseline of support near $7. The shares were trading at $6.65 on October 24.
Webjet (WEB)
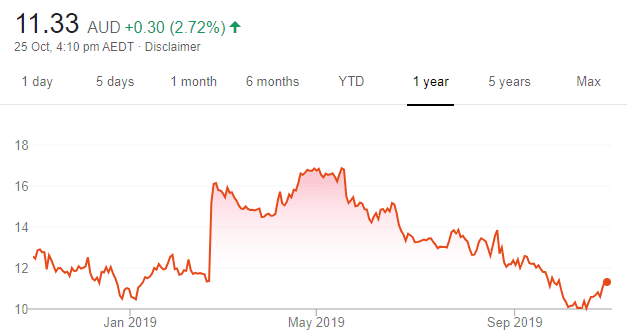
Chart: Share price over the year
After momentarily retesting the January low, shares in this online travel agency recently launched higher on the back of some good buying. With a solid line of support now established near $10, WEB looks set to at least partially recover some of its recent losses. The 52 week high was $17.19 on May 17. The shares were trading at $10.825 on October 24.
SELL RECOMMENDATIONS
Bendigo and Adelaide Bank (BEN)
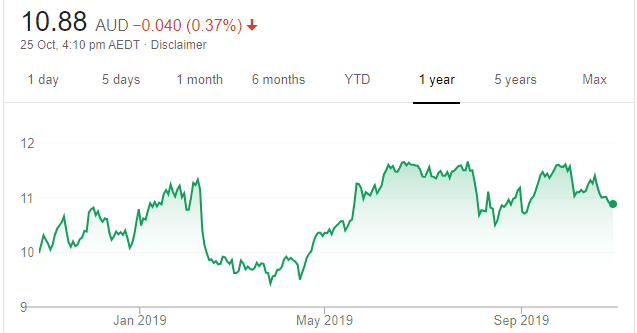
Chart: Share price over the year
After failing to reach a new high at the end of September, BEN shares have fallen again and the slide appears set to continue. With interest rates heading lower and margins under pressure, regional banks aren’t as attractive as the big majors at this stage.
Appen (APX)
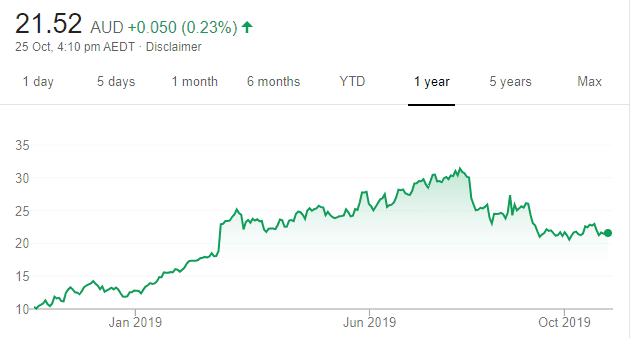
Chart: Share price over the year
We turned negative on this language technology and data services firm in August and it continues to look weak. A lot of volume was recently going through the stock on the downside, and this was weighing on the share price. At this rate, we’re likely to see it fall below $20, in our view. The 52 week high was $32 on July 30. The shares were trading at $21.76 on October 24.

Tony Paterno, Ord Minnett
BUY RECOMMENDATIONS
Nine Entertainment Co. Holdings (NEC)
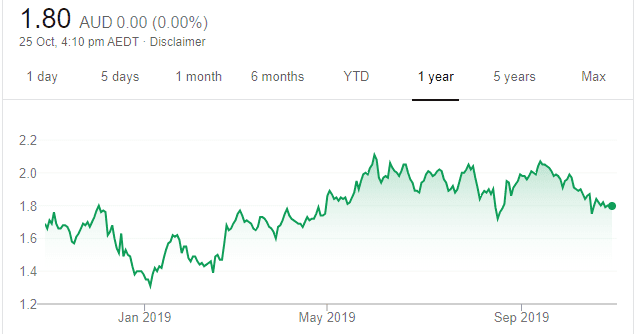
Chart: Share price over the year
Nine has successfully diversified its revenue base away from the traditional broadcast TV business and into digital media growth areas. With only 47 per cent of group revenues generated from TV, the business is now less susceptible to the structural and cyclical headwinds of TV ad spending. Owning real estate website Domain and entertainment streaming company Stan should help boost long term growth. Nine’s low debt levels should also provide opportunities for further merger and acquisition activity, or a capital return.
Myer Holdings (MYR)
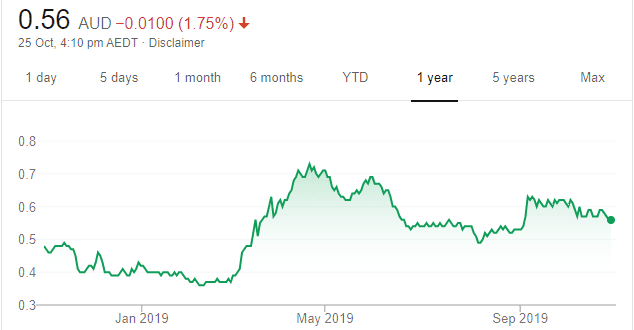
Chart: Share price over the year
Chief executive John King is leading the turnaround at this department store chain. Myer is addressing 20 per cent of floor space it wishes to improve, and costs are being reduced. An improving product range should lead to better gross margins. Also, MYR is focusing on growing online sales. We believe there’s valuation support.
HOLD RECOMMENDATIONS
Coca-Cola Amatil (CCL)
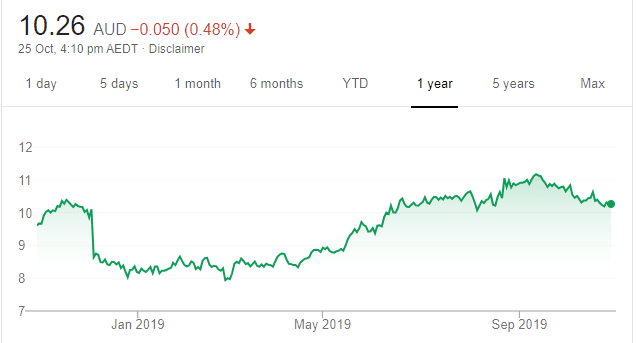
Chart: Share price over the year
Plans and execution so far from new Australian Beverages managing director Peter West have been impressive. Focusing on growth, the company is re-investing in the route trade where core competitive advantages exist. Valuation support is limited, but attractive compared to other large Australian consumer staple peers. The shares have risen from $7.84 on February 27 to finish at $10.31 on October 24.
Boral (BLD)
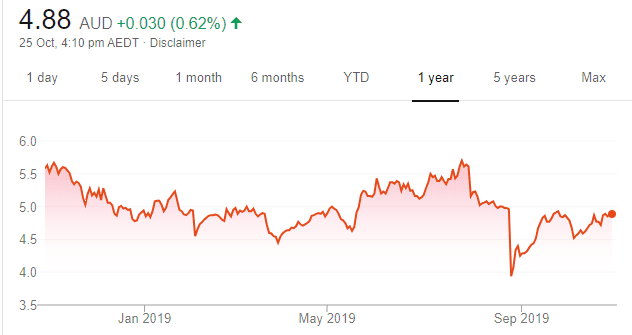
Chart: Share price over the year
In our view, the outlook for concrete demand in Australia is underwhelming. Challenging residential construction conditions remain in Australia and overseas, so we’re reluctant to factor in the announced synergy benefits in addition to underlying growth. We hold back from a more negative rating, as market sentiment towards the stock already appears weak and we also acknowledge takeover speculation. Shares in this building products maker finished at $4.85 on October 24.
SELL RECOMMENDATIONS
Medibank Private (MPL)
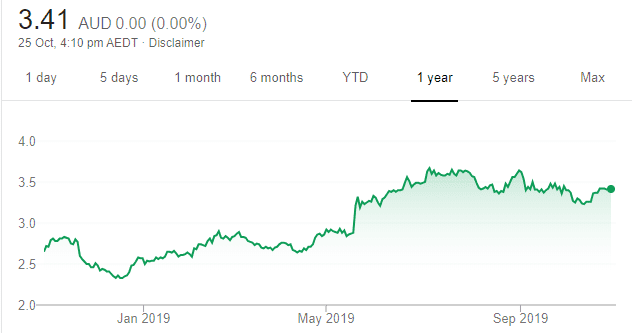
Chart: Share price over the year
The private health insurance sector is mired in politics. There’s been increasing political pressure to continue with low rate premium increases going forward. In our view, other sectors offer better growth potential. MPL, like other insurers, face challenges in retaining market share. MPL has enjoyed a good run since the coalition government was returned in May, so investors may want to consider taking profits.
Cochlear (COH)
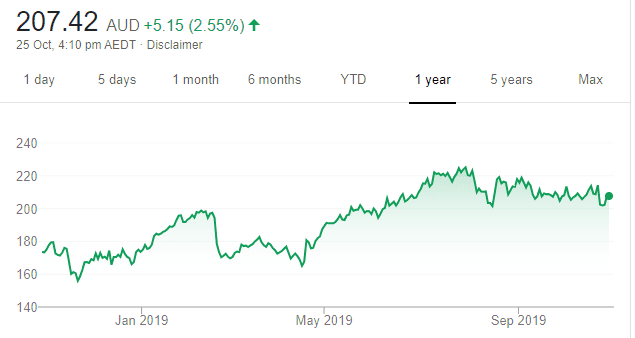
Chart: Share price over the year
Shares in this hearing implants maker have essentially traded sideways since August 14 when they were priced at $203.37. The shares closed at $202.27 on October 24. The company’s product range is a market leader, but we see competitors closing the gap. In our view, risk outweighs reward at these levels.
The above recommendations are general advice and don’t take into account any individual’s objectives, financial situation or needs. Investors are advised to seek their own professional advice before investing.
Please note that TheBull.com.au simply publishes broker recommendations on this page. The publication of these recommendations does not in any way constitute a recommendation on the part of TheBull.com.au. You should seek professional advice before making any investment decisions.