
See our brand new top 10 broker reviews. Find your perfect platform!

Elio D’Amato, Lincoln Indicators
BUY RECOMMENDATIONS
Appen (APX)
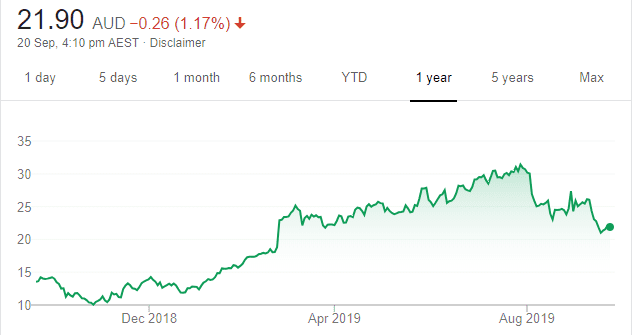
Chart: Share price over the year
The share price of this language technology and data services firm has been volatile after releasing its August report. This was mostly due its recent acquisition Figure Eight dragging on what was impressive profit growth. The company did retain EBITDA guidance, and we feel it’s achievable. Given solid underlying demand for its services, recent price volatility has created an opportunity for investors to acquire a quality global IT company at an attractive price.
WiseTech Global (WTC)
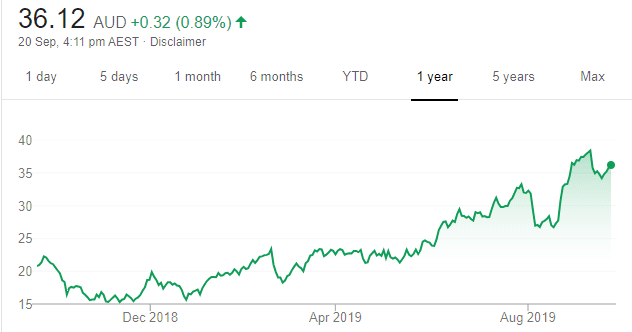
Chart: Share price over the year
This software logistics provider has established a track record of generating strong cash amid a proven ability to successfully embed new acquisitions. Concerns arose earlier this year about the pace of acquisitions and the detrimental impact it was having on the balance sheet. However, the company has rapidly addressed these concerns and returned to strong financial health. We expect it to continue growing in the future.
HOLD RECOMMENDATIONS
IDP Education (IEL)
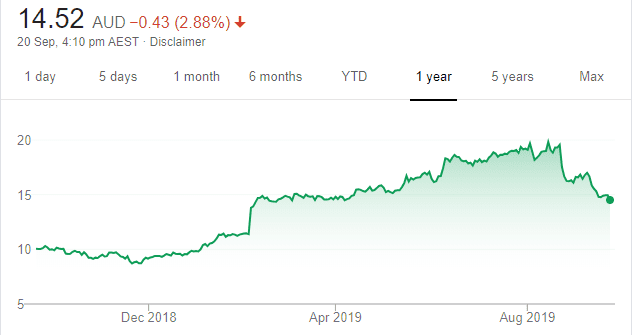
Chart: Share price over the year
The share price of this education solutions firm fell from a lofty $19.57 on August 21 to trade at $14.98 on September 20. Latest full year revenue was up 23 per cent on the prior corresponding period to $598 million, and net profit after tax rose 29 per cent to $66.3 million. Its last result exhibited strong quality elements. The continuing rollout of computer-delivered IELTS (International English Language Testing System) supports our positive view that IEL will retain its performance into fiscal year 2020.
Telstra Corporation (TLS)
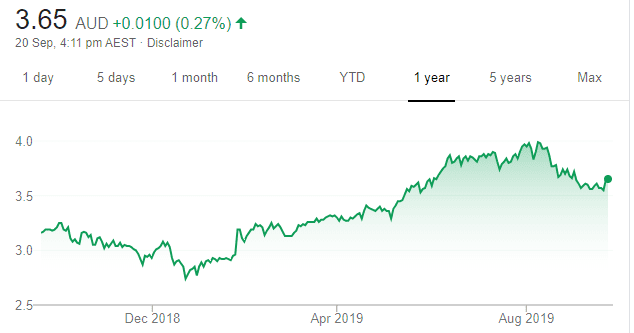
Chart: Share price over the year
Telstra is a defensive quality stock generating an attractive income. For some time, it’s retained a strong market position and enjoyed a reputation for reliability. Growth elements are returning to the business after a long hiatus in response to delays with the NBN rollout, improving cost efficiencies and the future potential in the 5G space. This hypothesis was supported by the progress highlighted in its latest results.
SELL RECOMMENDATIONS
Cimic Group (CIM)
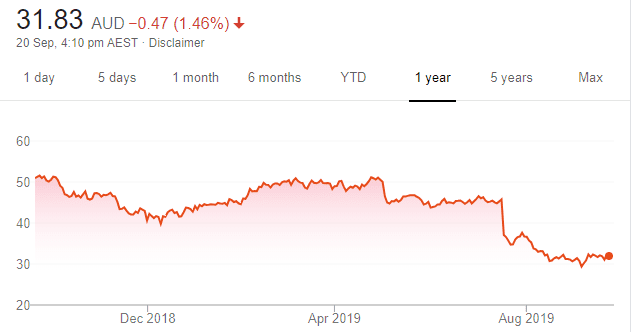
Chart: Share price over the year
This engineering-led construction and mining firm has a growing order book supported by strong infrastructure tailwinds. Against this backdrop are projects generating wafer thin margins. Our concerns, based around the company’s earnings quality, aggressive revenue recognition and Middle East challenges, are behind our recommendation.
Coca-Cola Amatil (CCL)
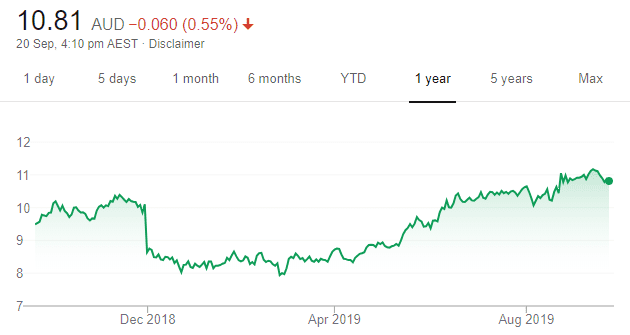
Chart: Share price over the year
Top Australian Brokers
- Pepperstone - multi-asset Australian broker - Read our review
- eToro - market-leading social trading platform - Read our review
- IC Markets - experienced and highly regulated - Read our review
In our view, there’s a disconnect between the beverage maker’s share price and its fundamentals. Despite strong financial health, it faces continuing growth challenges in its Australian business and we’ve concluded that next year’s forecasts are negative. With revenue, margins and return on equity deteriorating, we can’t see any fundamental drivers to support prices up at these levels. The shares were trading at $10.88 on September 20. Investors should consider locking in gains.

Jabin Hallihan, Morgans
BUY RECOMMENDATIONS
Senex Energy (SXY)
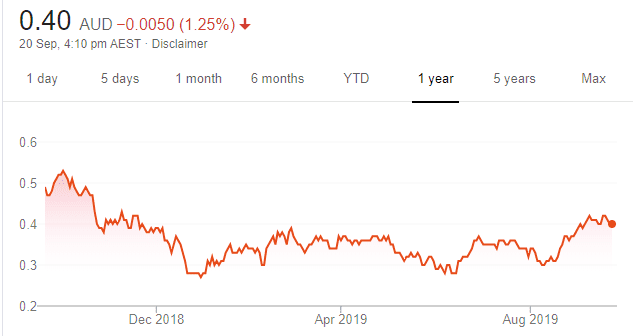
Chart: Share price over the year
This oil and gas producer has all the vital ingredients for growth. Its assets in the Cooper and Surat Basins are backed by a strong balance sheet to fund its ongoing drilling campaign. With access to markets, reserves, funding and a good management team, SXY is also a possible takeover target. We retain our add rating.
Oil Search (OSH)
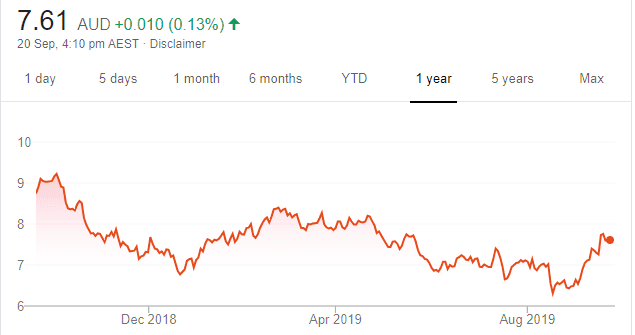
Chart: Share price over the year
The expansion phase of the Papua New Guinea liquefied natural gas (LNG) development project has been de-risked, with the new Papua New Guinea Government pledging to honour existing gas agreements signed by its predecessors. In our view, this is an ideal outcome for OSH. We upgrade our valuation with increased confidence.
HOLD RECOMMENDATIONS
Bellamy’s Australia (BAL)
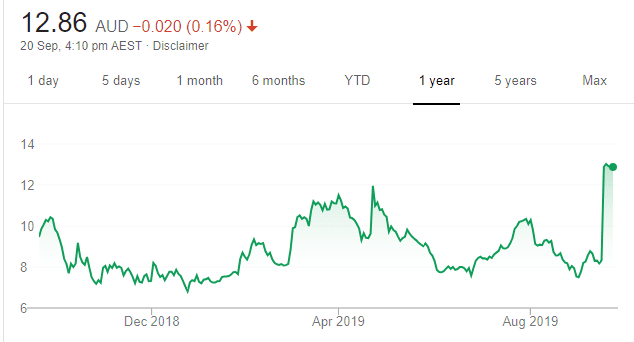
Chart: Share price over the year
Chinese dairy company Mengniu has launched a potential takeover for this infant formula company totalling $A13.25 cash a share, which includes a special dividend of 60 cents from BAL. The takeover is subject to approvals, including from the Foreign Investment Review Board. The share price soared on the takeover announcement. Consider holding for possibly more developments, including a potentially competitive bid.
JB Hi-Fi (JBH)
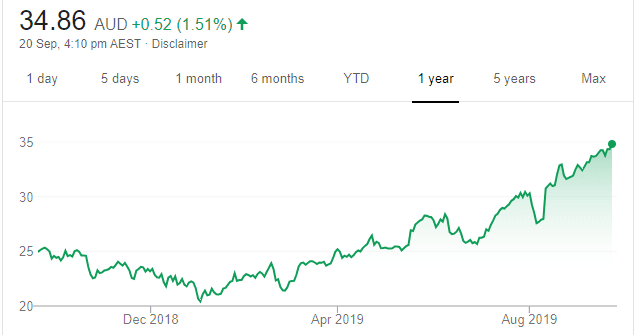
Chart: Share price over the year
The consumer electronics giant reported a 3.5 per cent increase in total sales to $7.1 billion for the 2019 financial year. Earnings per share were up 7.1 per cent to $2.174. Company guidance for total sales growth in 2020 is 2.2 per cent. We think the current valuation is fair for a company with a modest growth profile and suggest investors consider holding for now.
SELL RECOMMENDATIONS
Costa Group Holdings (CGC)
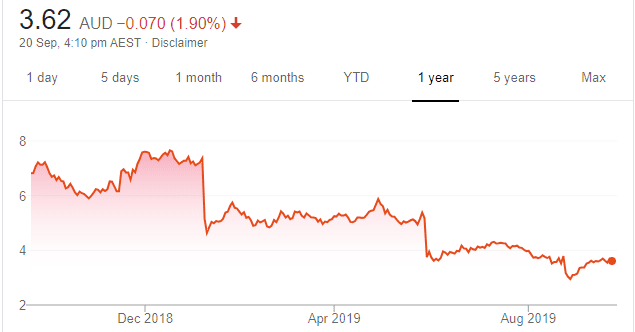
Chart: Share price over the year
Following what we consider a disappointing first half result, we’ve decided to exit this horticultural company. We’re concerned that net debt to equity levels are stretched and this may result in a dilutive capital raising going forward. The shares have fallen from $7.79 on December 3, 2018 to trade at $3.70 on September 19, 2019.
AMP (AMP)
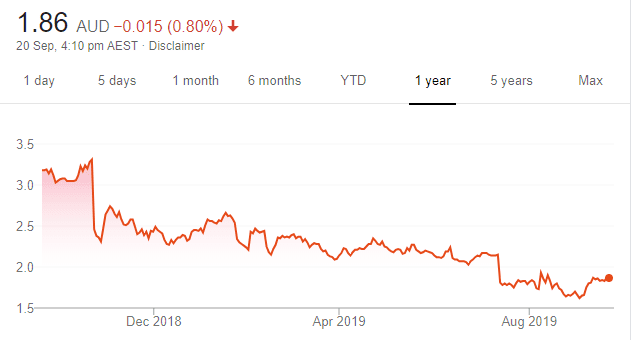
Chart: Share price over the year
Following a disappointing $2.3 billion half year loss, it will take considerable time to turn this wealth manager around amid significant execution risk. We’re not yet convinced AMP’s share price has bottomed and believe better opportunities exist elsewhere. The shares were trading at $1.877 on September 19.

Michael Kodari, KOSEC
BUY RECOMMENDATIONS
Beach Energy (BPT)
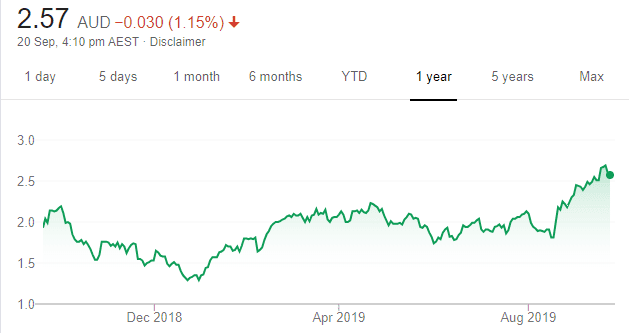
Chart: Share price over the year
The recent drone strike on the world’s largest crude oil processing plant in Saudi Arabia wiped 5 per cent off global capacity. Consequently, crude oil prices soared to the benefit of producers, such as Beach. Also, Beach performed strongly in fiscal year 2019, with underlying EBITDA up 80 per cent on the prior corresponding period to $1.375 billion. Underlying net profit after tax rose 86 per cent to $560 million. The future appears bright.
Ramelius Resources (RMS)
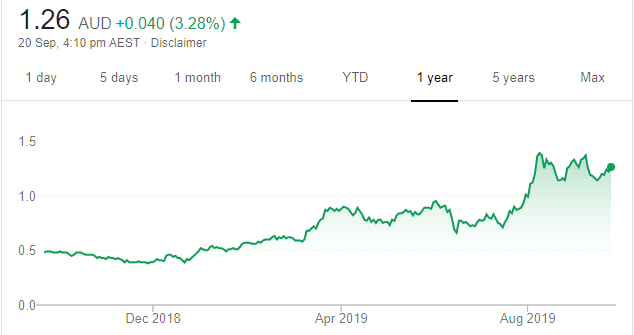
Chart: Share price over the year
Gold has enjoyed a strong rally during 2019, with the price hitting a year high of about $US1550 an ounce. The low interest rate environment has driven investors to gold for superior returns. Gold producer Ramelius benefits from a rising bullion price. The company has upgraded gold production guidance for fiscal year 2020 to a top end of 225,000 ounces.
HOLD RECOMMENDATIONS
PolyNovo (PNV)
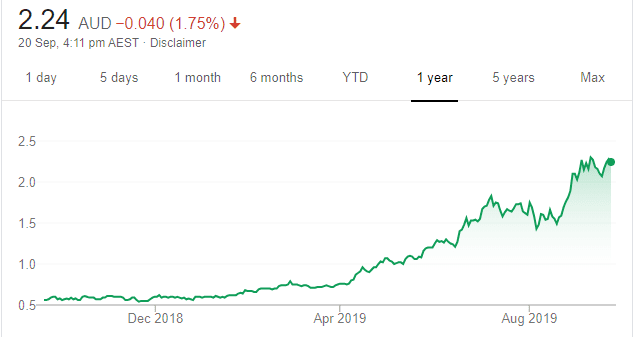
Chart: Share price over the year
On May 1, this medical device company announced it had been granted access to US Department of Defence contracts. This enables the US Department of Defence access to buy PNV’s, NovoSorb BTM (biodegradable temporising matrix) wound dressing treatment for US military personnel and their families. This contract helped PNV generate more than $1 million in revenue in April. Its post research and development performance has elevated the stock from the S&P/ASX 300 to the S&P/ASX200 index.
Pro Medicus (PME)
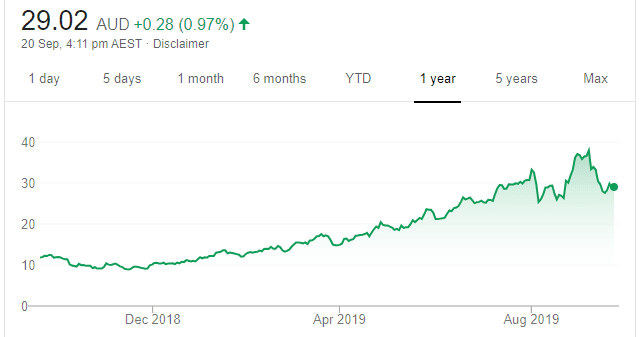
Chart: Share price over the year
Specialises in enterprise imaging and radiology information software. In the past financial year, the company secured seven-year contracts in the US. The deal with Duke Health is worth $14 million and the other with Partners HealthCare is worth $27 million. The company’s latest result revealed a strong performance, with revenue up 47.9 per cent to $50.1 million and earnings before interest and tax margins increasing 51.6 per cent.
SELL RECOMMENDATIONS
Praemium (PPS)
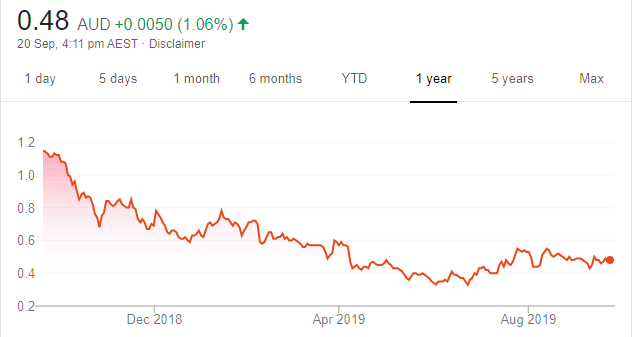
Chart: Share price over the year
This investment administration company posted a positive full year report, with funds under administration increasing by 25 per cent to $9.5 billion. However, the stock has been on a downward trend since hitting a 52 week high of $1.185 on September 24, 2018. We’re concerned about momentum. The shares were trading at 48 cents on September 19, 2019.
Nearmap (NEA)
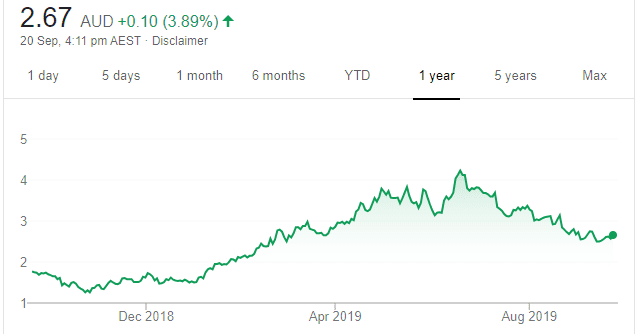
Chart: Share price over the year
This aerial imagery company has experienced substantial growth in the past couple of years, and recently expanded to the US. However, the stock has taken a dive since the company released its preliminary results on July 12 this year. Its annual report, released on August 21, 2019, shows the company has been operating at a net loss after tax for at least the past two years. The stock has fallen from from a 52-week high of $4.29 on June 20, 2019 to trade at $2.585 on September 19, 2019. The stock is struggling to gain momentum.
The above recommendations are general advice and don’t take into account any individual’s objectives, financial situation or needs. Investors are advised to seek their own professional advice before investing.
Please note that TheBull.com.au simply publishes broker recommendations on this page. The publication of these recommendations does not in any way constitute a recommendation on the part of TheBull.com.au. You should seek professional advice before making any investment decisions.