
See our brand new top 10 broker reviews. Find your perfect platform!

Janine Cox, Wealth Within
BUY RECOMMENDATIONS
Bendigo and Adelaide Bank (BEN)
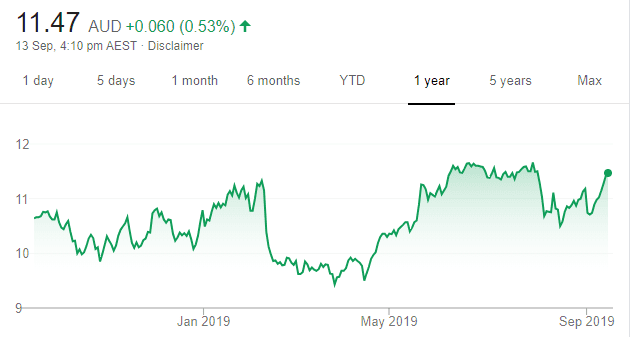
Chart: Share price over the year
The longer term technical chart for this second tier bank indicates that potential exists for a strong rise in coming months. Before considering BEN as a buy, the price must rise strongly above $11.50 to reduce the risk of entering on a false signal. The shares were trading at $11.30 on September 12.
Bega Cheese (BGA)
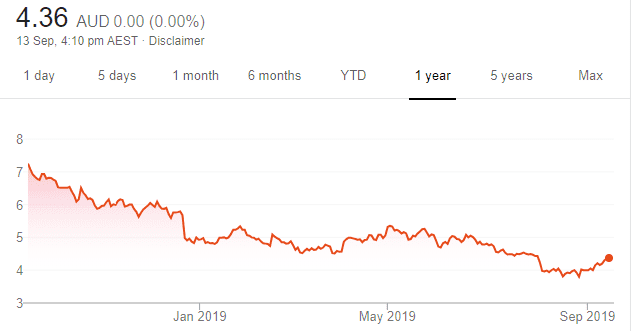
Chart: Share price over the year
The share price doesn’t reflect strong buyer support. Following a high of $8.15 in July 2018, BGA’s share price proceeded to lose more than half its value by falling to $3.79 in August 2019. Currently, BGA’s share price appears to be finding support for the next rise, which, we believe, is likely to occur in the short term. Given the higher risk, a favourable technical entry is required before buying. The shares were trading at $4.35 on September 12.
HOLD RECOMMENDATIONS
Atlas Arteria (ALX)
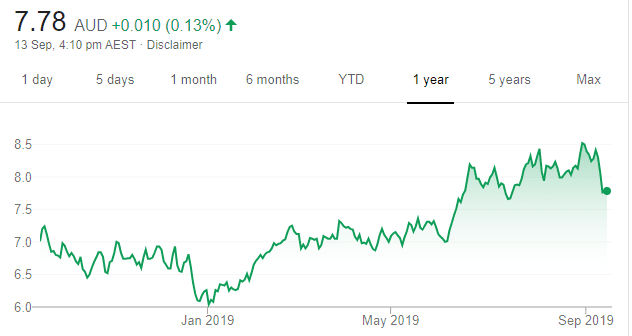
Chart: Share price over the year
Owns and operates toll roads in France, Germany and the US. ALX reached new all time highs in August, as investors shifted to more defensive companies amid the Australian sharemarket attempting to rebound towards its all time high. ALX has held up well in September and investors should consider holding for further gains.
Beach Energy (BPT)
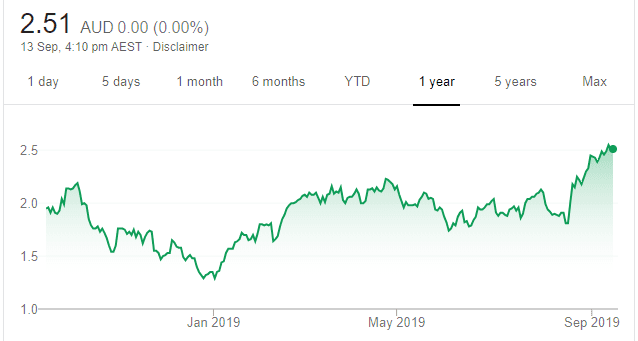
Chart: Share price over the year
The share price of this oil and gas producer recently accelerated above an important level of resistance around $2.20. Strong buying momentum is likely drive the stock higher. However, the stock is highly volatile and the price may rapidly reverse, which is why we view it as a trading stock. Watch for a reversal signal between $2.60 and $2.80. If this occurs, a sell signal may follow. The shares were trading at $2.485 on September 12.
SELL RECOMMENDATIONS
ASX Limited (ASX)
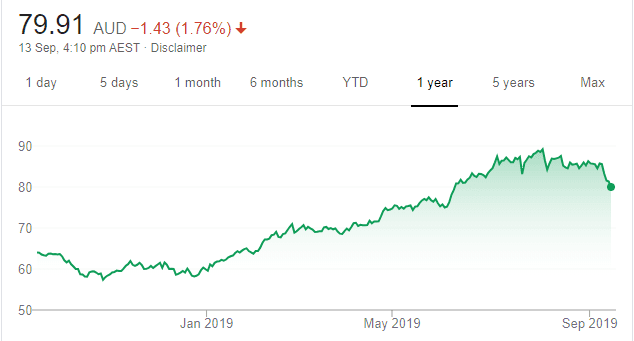
Chart: Share price over the year
The ASX may continue to rise towards $100 in coming months. However, stick to your exit rules, as further potential gains could be rapidly erased if the share price reverses. The ASX share price has accelerated steeply above the angle of the longer term rise, so a sharp correction of about 20 per cent is possible before the end of the year, or into January. A strong weekly close below $83.55 would indicate it’s time to take some profit. The shares were trading at $81.66 on September 12.
Bingo Industries (BIN)
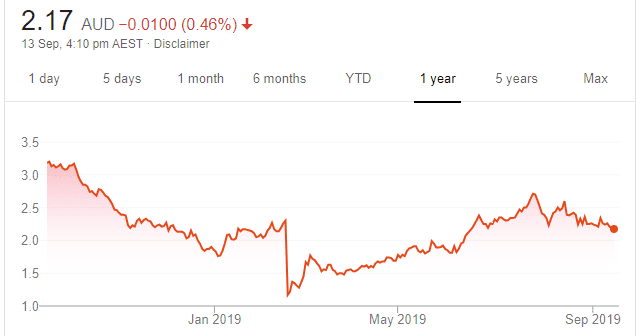
Chart: Share price over the year
Top Australian Brokers
- Pepperstone - multi-asset Australian broker - Read our review
- eToro - market-leading social trading platform - Read our review
- IC Markets - experienced and highly regulated - Read our review
The share price of this waste management company has traded sideways from August through to early September 2019, indicating an agreement between some buyers and sellers. If the share price trades below $2.15, we believe a sell signal on the technical chart is highly likely to occur. The shares were trading at $2.20 on September 12.

John Athanasiou, Red Leaf Securities
BUY RECOMMENDATIONS
REA Group (REA)
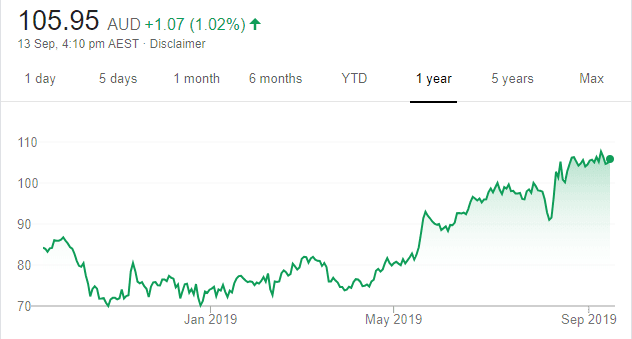
Chart: Share price over the year
REA is a high quality digital advertising company specialising in property and exposed to a recovering sector. An improving real estate market should encourage more property listings to the benefit REA’s financials. Additionally, REA’s investments in overseas property websites could add further value in the long term.
Viva Leisure (VVA)
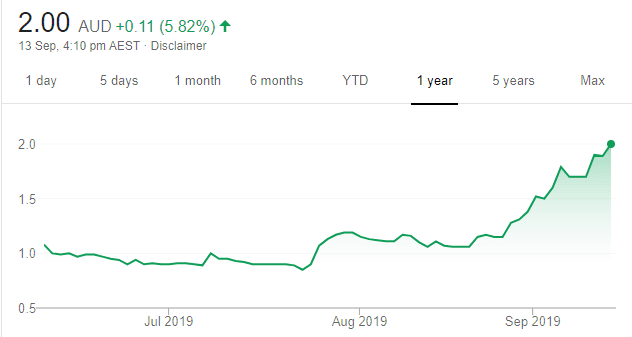
Chart: Share price over the year
Viva owns more than 40 health clubs in Australia. Free cash flow should continue to grow strongly. Its total membership base grew by 51.6 per cent to 54,039 in the 2019 financial year. The company generates strong recurring revenue. Listing in June 2019, the company beat its prospectus forecasts on key financial metrics. We believe there’s plenty of upside given it’s trading on an undemanding multiple.
HOLD RECOMMENDATIONS
Afterpay Touch Group (APT)
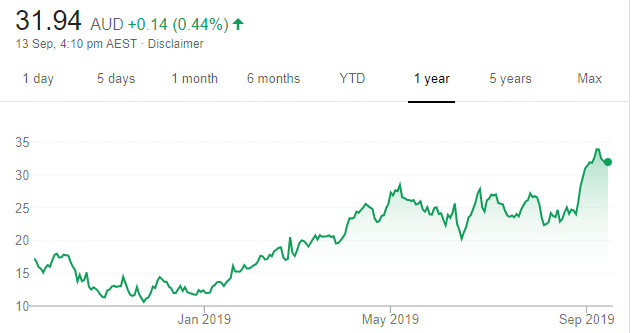
Chart: Share price over the year
This buy now, pay later company is one of the best performing stocks on the ASX. The company has successfully entered the UK and US markets. It should continue to grow overseas, but the stock is priced to perfection and leaves little room for error. The share price has almost doubled in the past 12 months to close at $31.80 on September 12.
Macquarie Group (MQG)
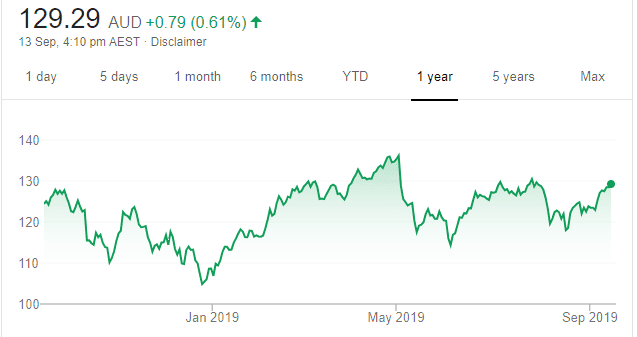
Chart: Share price over the year
Macquarie has been a good investment for our clients. The company recently raised $1 billion from an institutional placement to finance new initiatives in the renewables, infrastructure and technology sectors. Macquarie provides investors with leverage to a low interest rate environment, which is a positive. But, in our view, the opportunistic capital raise implies the company is possibly fully valued at this point.
SELL RECOMMENDATIONS
Magellan Financial Group (MFG)
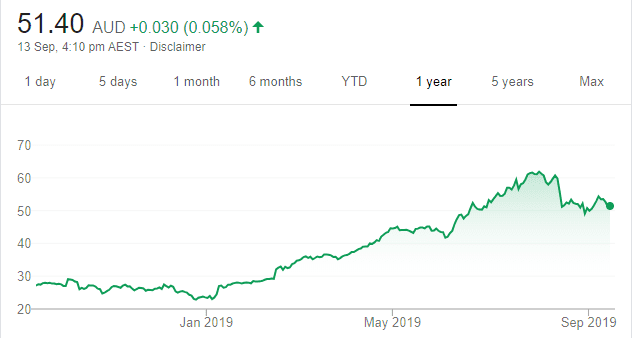
Chart: Share price over the year
This global fund manager has been a market darling for a long time. However, in our view, MFG was recently trading on a lofty price/earnings multiple of about 25 times. That implies the company will continue to generate inflows and performance fees at attractive current rates. We believe past strong growth will be difficult to sustain in the short to medium term. The shares have risen from $23.37 on January 2 this year to finish at $51.37 on September 12. Investors may want to consider taking some profits.
McGrath (MEA)
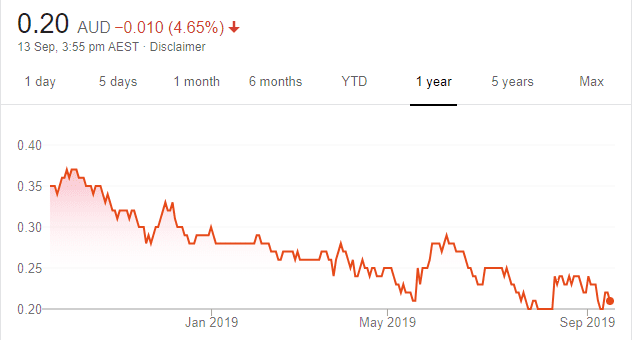
Chart: Share price over the year
This serial underperformer should benefit from an improving property market, but we still rate the company a sell until management can prove it can turn things around. Based on the past, we remain sceptical that this real estate group can improve its performance – at least in the short term. The 52 week high was 37 cents on October 3 last year. The shares closed at 21.5 cents on September 12 this year.

Tony Paterno, Ord Minnett
BUY RECOMMENDATIONS
Myer Holdings (MYR)
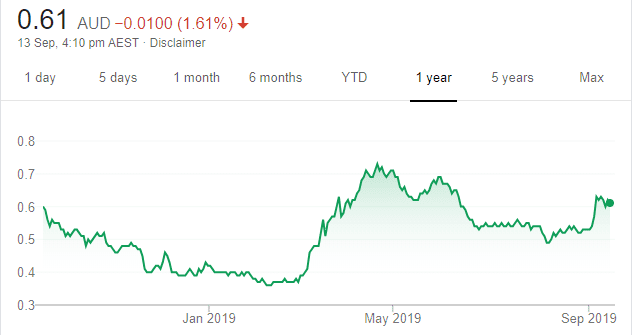
Chart: Share price over the year
There’s a turnaround happening at Myer under new management led by department store chief executive John King. An improving product range should lead to better gross margins amid reducing costs. Also, MYR is focusing on growing online sales. We believe there’s valuation support. The stock was trading at 61 cents on September 13.
Telstra (TLS)
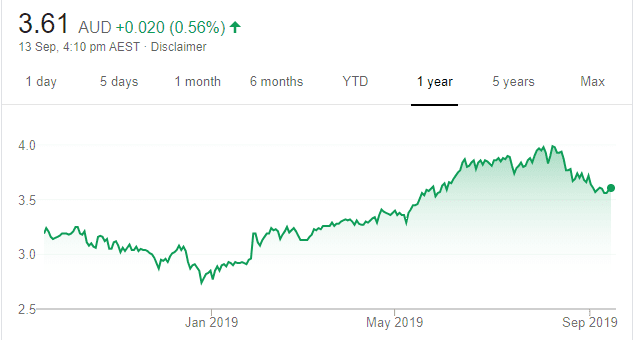
Chart: Share price over the year
We expect Telstra to continue dominating Australia’s telecommunications market. In the absence of a new mobile entrant amid a more benign competitive environment, we believe the current valuation is attractive. We see potential upside from possibly more interest rate cuts and the rollout of the 5G network.
HOLD RECOMMENDATIONS
APA Group (APA)
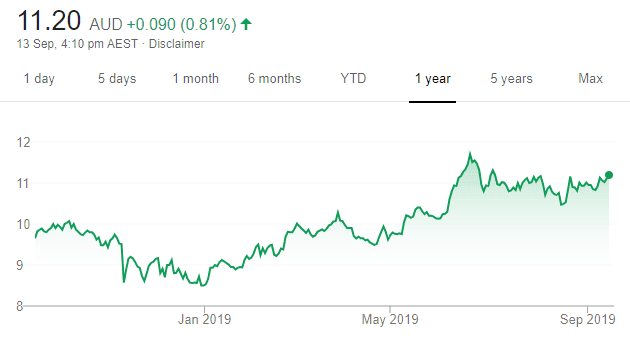
Chart: Share price over the year
This energy and infrastructure company continues to execute and beat guidance. However, continuing to generate organic growth in Australia at current rates could be difficult given renewable project returns are significantly lower now than in the past. This could be behind APA accelerating efforts to grow via acquisition in the US.
Computershare (CPU)
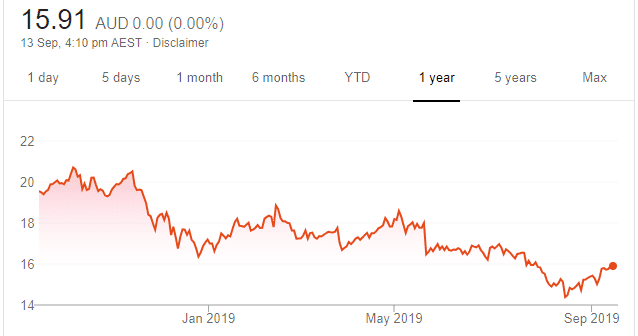
Chart: Share price over the year
We see this share registry company as fairly priced. Registry maintenance provides a stable revenue stream. The mortgage servicing business in the US is anticipated to be a key driver of growth from here. The shares have risen from a 52 week low of $14.18 on August 15 to trade at $15.895 on September 13.
SELL RECOMMENDATIONS
Cochlear (COH)
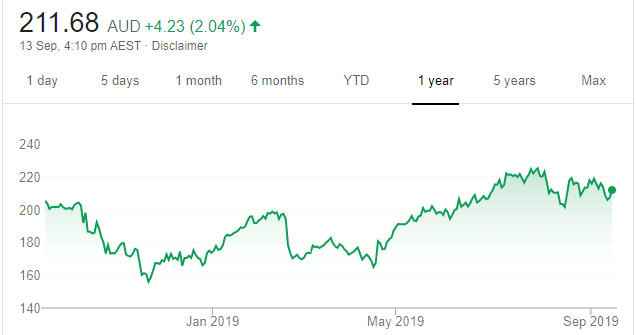
Chart: Share price over the year
The hearing implants maker recorded a 52 week high of $226.71 on July 30, 2019. The company’s product range is a market leader, but we see competitors closing the gap. In our view, risk outweighs reward at these levels, which is behind our lighten recommendation. The shares were trading at $210.48 on September 13.
Mirvac Group (MGR)
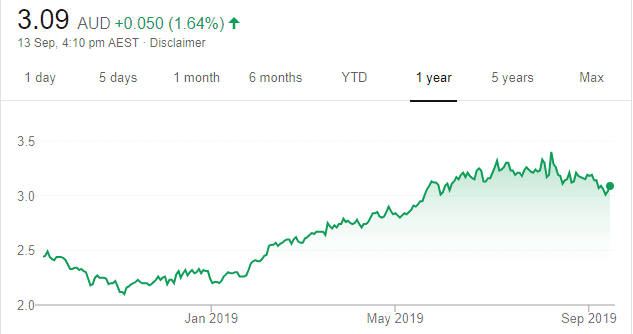
Chart: Share price over the year
This diversified property group is a good business. Net tangible asset growth will continue from its office portfolio, but we believe this is reflected in the price. We see earnings pressure beyond what is expected to be a strong fiscal year in 2020. We believe commercial development profits will possibly peak in fiscal year 2020. In our view, MGR is well managed, but fully valued. MGR reached a 52 week high of $3.415 on August 8, 2019. The shares were trading at $3.07 on September 13.
The above recommendations are general advice and don’t take into account any individual’s objectives, financial situation or needs. Investors are advised to seek their own professional advice before investing.
Please note that TheBull.com.au simply publishes broker recommendations on this page. The publication of these recommendations does not in any way constitute a recommendation on the part of TheBull.com.au. You should seek professional advice before making any investment decisions.