
Free Knigthsbridge Trading Academy woth $2750 with Axitrader

Tom Bleakley, BW Equities
BUY RECOMMENDATIONS
Family Zone Cyber Safety (FZO)
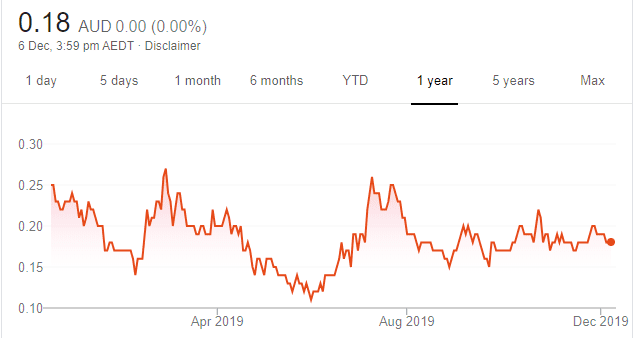
Chart: Share price over the year
Family Zone’s cyber security platform is a cloud based internet filter for schools and families. Family Zone is gaining traction, with increasing sales in North American schools. It also recently announced a joint venture with Telkomsel, Indonesia’s largest cellular operator. Telkomsel has more than 170 million subscribers, so Indonesia presents a huge marketing opportunity. FZO shares finished at 18 cents on December 5.
5G Networks (5GN)
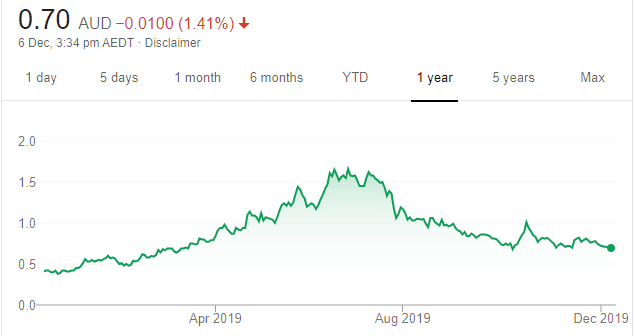
Chart: Share price over the year
5GN is an integrated telecommunications company, operating data centres, cloud and managed services. 5GN has started acquiring other telco businesses, with a focus on the data centre market. We expect the data centre market to continue growing, with businesses shifting to cloud based technologies. Managing director Joe Demase is suitably skilled and experienced to acquire and integrate private telco businesses into 5GN.
HOLD RECOMMENDATIONS
SenSen Networks (SNS)
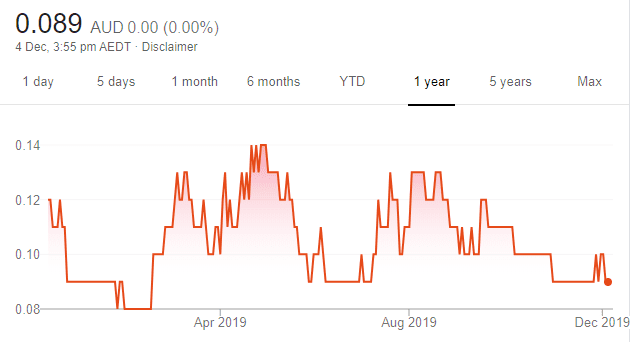
Chart: Share price over the year
SenSen is a video analytics company, focusing on car parking compliance and toll road enforcement. Customers include Transurban and many councils in Australia and North America. The market is anticipating commercial opportunities from its technology used on toll roads. It’s also anticipating a growing number of councils will use SenSen technology to enforce car parking laws. SNS requested a trading halt on December 5 pending an announcement.
Carbon Revolution (CBR)
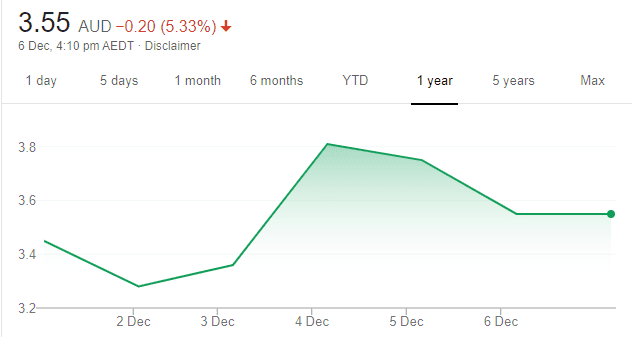
Chart: Share price over the year
Carbon Revolution is a recently listed company, supplying carbon fibre wheels to luxury car makers. Demand for its product is strong. The company isn’t yet profitable. However, with the funds from the IPO amid expanding to new car makers, CBR is forecasting revenue to rise from $15.1 million in financial year 2019 to $62.2 million in financial year 2020.
SELL RECOMMENDATIONS
GrainCorp (GNC)
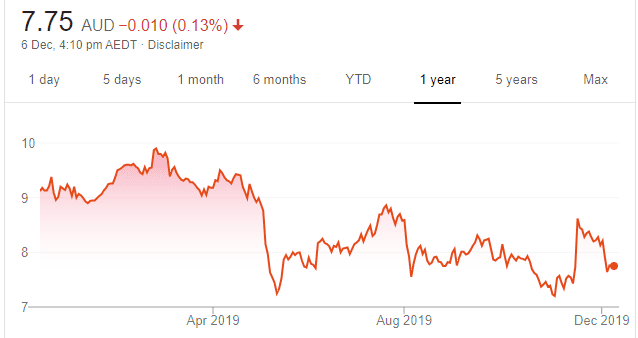
Chart: Share price over the year
An integrated grain business across storage, logistics and marketing. It focuses on the east coast regions of Australia. We expect the severe drought in New South Wales and Queensland to slow volumes through the GrainCorp system. In our view, the general grain market won’t be relying as much on GNC’s bulk terminals, as we see a shift towards container shipments. In our opinion, GrainCorp’s asset heavy business will be leveraged into lower margins going forward.
Domino’s Pizza Enterprises (DMP)
Top Australian Brokers
- Pepperstone - multi-asset Australian broker - Read our review
- eToro - market-leading social trading platform - Read our review
- IC Markets - experienced and highly regulated - Read our review
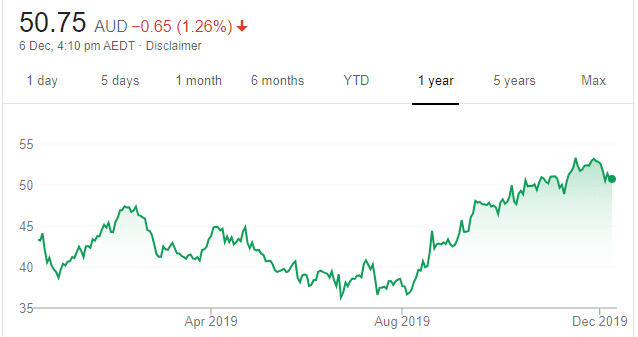
Chart: Share price over the year
Domino’s trades on high growth multiples. Managing director Don Meij sold DMP shares in September and November 2019. The company says the funds from the share sales will be used to meet tax obligations. Meij still remains one of the largest shareholders in the company. In our view, DMP will have to invest heavily in marketing and capital expenditure to retain previous growth, potentially resulting in lower margins going forward.

Michael Gable, Fairmont Equities
BUY RECOMMENDATIONS
Rio Tinto (RIO)
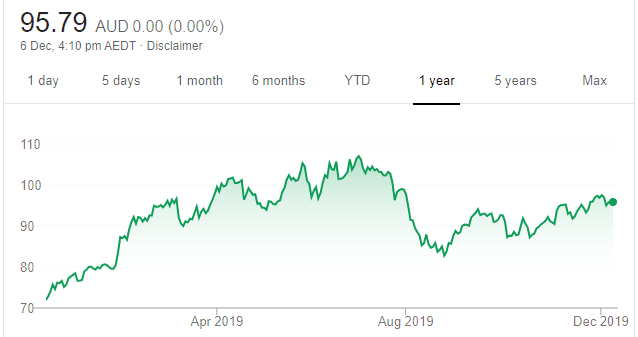
Chart: Share price over the year
Since turning bullish again on commodity stocks a few months ago, we believe the sector will outperform on the back of what we believe will be improving global economic growth in 2020. Rio shares continue to trade in a positive way and look set to push beyond their prior highs. Any dips present a buying opportunity. The shares were trading at $95.63 on December 5.
Santos (STO)
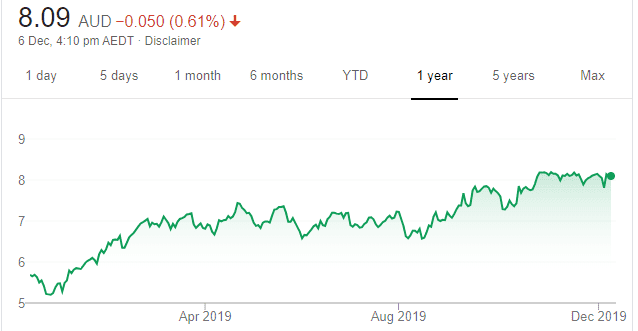
Chart: Share price over the year
Next year looks encouraging for the energy sector as we expect increasing demand for oil and gas. STO continues to trade well and appears well supported each time it takes a dip. We’re confident the uptrend will continue on through the first half of 2020.
HOLD RECOMMENDATIONS
Dexus (DXS)
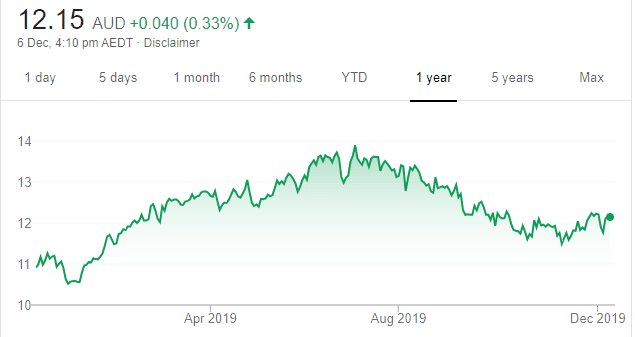
Chart: Share price over the year
This property trust looks reasonable value compared to its peers, and the company’s charting profile indicates it’s ready to head higher again. With an ex-dividend date towards the end of December, we believe buying support should see the share price moving higher from here.
Magellan Financial Group (MFG)
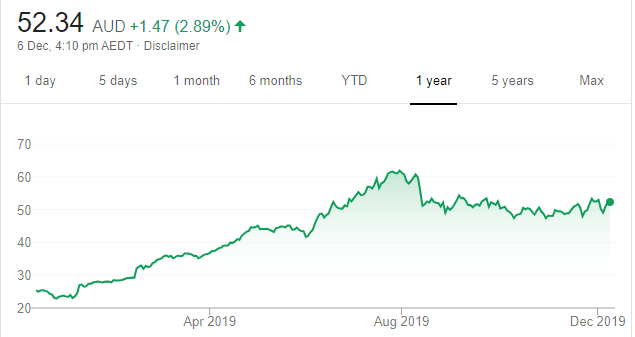
Chart: Share price over the year
After peaking in July, MFG then pulled back to consolidate the huge rally that started at the beginning of the year. It now appears consolidation is over and the global fund manger is set to move up again and retest its old high above $60.
SELL RECOMMENDATIONS
GUD Holdings (GUD)
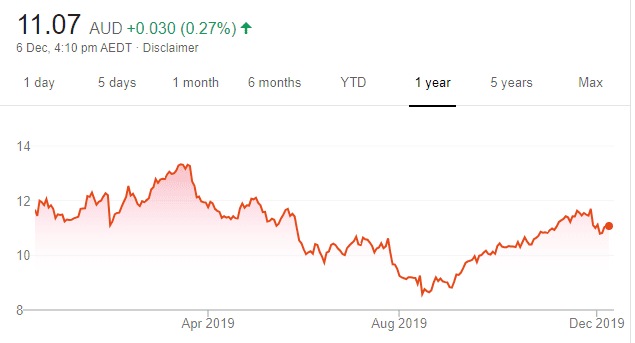
Chart: Share price over the year
The market seems to have factored in too much earnings improvement, but the share price, in my view, has gone too high too rapidly. Shares in this automotive and water products company have risen from $8.76 on August 16 to trade at $10.95 on December 5. We expect the share price to slide back to more reasonable levels.
InvoCare (IVC)
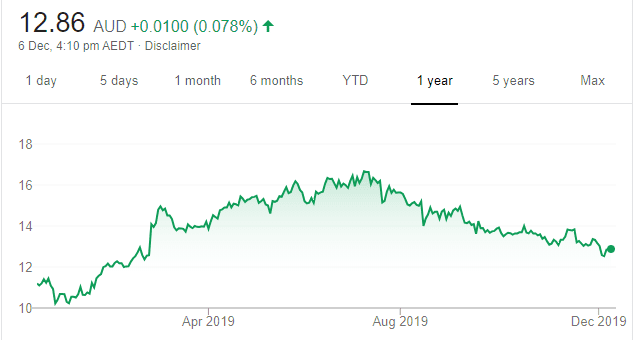
Chart: Share price over the year
Many analysts expect the death rate to rebound in this calendar year’s second half. However, IVC shares continue to trend lower, as the market starts to recognise the risk in this assumption. Last year, fewer people in Australia died during winter, and some attributed the decline to mild weather and an effective flu vaccine campaign. I expect the share price to drift back towards support near $12. Shares in this funeral company were trading at $12.85 on December 5.

Nathan Lodge, Lodge Partners
BUY RECOMMENDATIONS
Powerwrap (PWL)
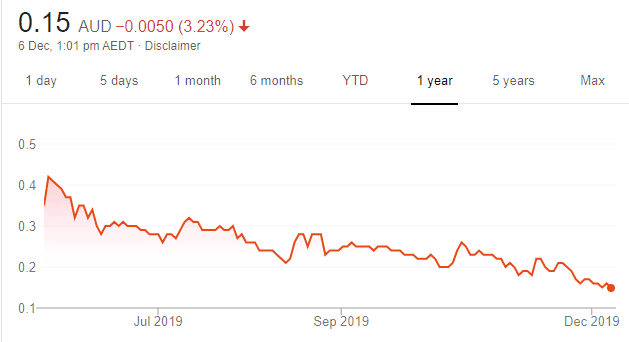
Chart: Share price over the year
We like this wealth management platform provider, as it continues to grow funds under administration (FUA). In its latest quarterly report, the company reported that funds under administration (FUA) grew by $276 million, or 3.41 per cent, to $8.38 billion. PWL is expecting new advisers under Escala Partners to be on board in the next two quarters, adding to net flows. Our FUA target is $9.8 billion by the end of fiscal year 2020. PWL trades at a discount to its peers. We believe the shares have been oversold. The shares were trading at 16 cents on December 5.
PayGroup (PYG)
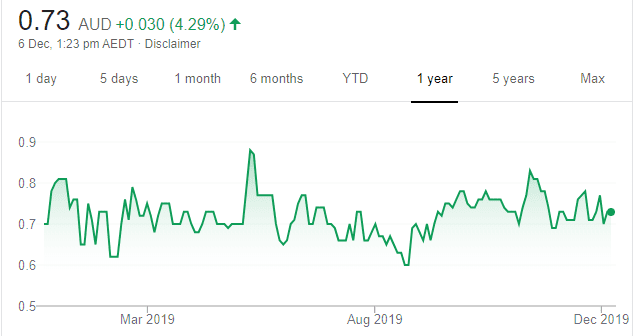
Chart: Share price over the year
This payroll and human capital management solutions provider reported statutory revenue of $3.4 million for the first half of fiscal year 2020. This represents a 17.8 per cent revenue increase on the second half of fiscal year 2019. What also appeals is the company reported client revenue retention of about 96 per cent. We believe PYG offers value relative to the Australian market and its listed international peers.
HOLD RECOMMENDATIONS
Energy Resources of Australia (ERA)
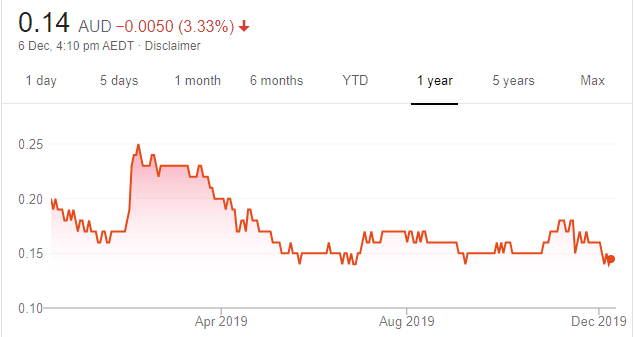
Chart: Share price over the year
Produces uranium oxide for the global nuclear energy market. Its Ranger mine is one of only three in the world to produce 120,000 tonnes of uranium oxide. Mining giant Rio Tinto owns 68.4 per cent of ERA. Speculation continues as to whether Rio wants to own 100 per cent of ERA. Rio is supporting ERA’s renounceable entitlement offer to raise $476 million for rehabilitating the Ranger project area in the Northern Territory. ERA is highly exposed to any potential uranium bull market.
Deep Yellow (DYL)
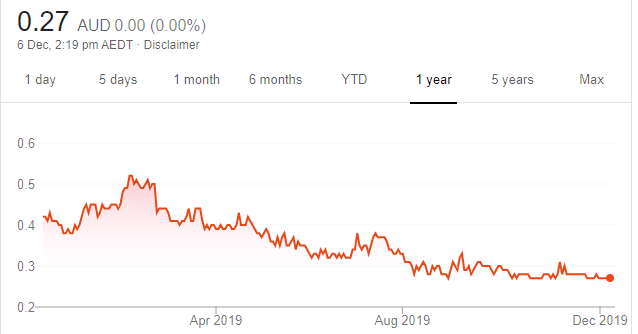
Chart: Share price over the year
The uranium company recently announced a significant increase in resource at the Tumas 1 East deposit located within the reptile project in Namibia. The resource grew by 34 per cent. Resource extension drilling has produced an inferred mineral resource estimate of 24.8 million pounds. Sixty kilometres of the target is still to be tested. Offers potential.
SELL RECOMMENDATIONS
Magellan Financial Group (MFG)
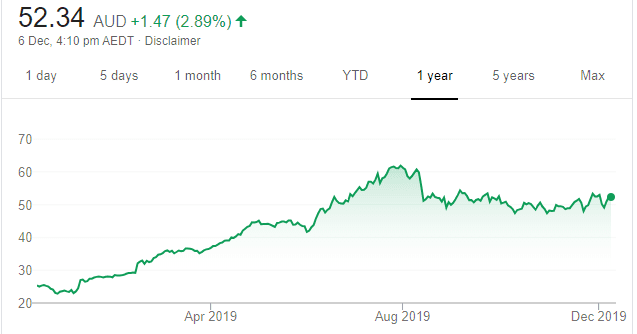
Chart: Share price over the year
The company is a success. It’s well managed. Net profit after tax rose 78 per cent to $376.9 million for fiscal year 2019. Total funds under management at November 29, 2019 were $97.715 billion. MFG continues to generate fund inflows. The company’s share price has risen from a 52 week low of $22.55 on December 24, 2018 to trade at $50.58 on December 5. However, the stock is way off its 12 month high of $62.60 on July 30 this year. In our view, the downtrend may continue, as the price is still relatively expensive. Investors can consider taking some profits.
AusCann Group Holdings (AC8)
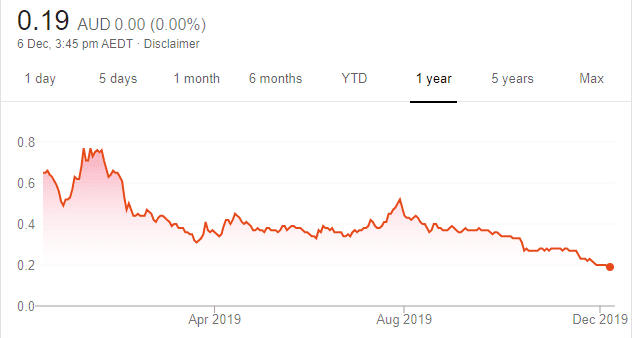
Chart: Share price over the year
We’re not a fan of medicinal cannabis stocks. In our view, hope and hype initially drove up medicinal cannabis company share prices rather than substance. In our opinion, Australia doesn’t seem to have a real competitive advantage and is quite a distance from major markets. AusCann’s share price has been in a downtrend. The shares have fallen from a 52 week high of 79 cents on January 9, 2019 to trade at 19 cents on December 5.
The above recommendations are general advice and don’t take into account any individual’s objectives, financial situation or needs. Investors are advised to seek their own professional advice before investing.
Please note that TheBull.com.au simply publishes broker recommendations on this page. The publication of these recommendations does not in any way constitute a recommendation on the part of TheBull.com.au. You should seek professional advice before making any investment decisions.