
See our brand new top 10 broker reviews. Find your perfect platform!

Chris Conway, Marcus Today
BUY RECOMMENDATIONS
Integrated Research (IRI)

Chart: Share price over the year
This software provider has a strong and stable earnings base. Almost 90 per cent of revenue is recurring, and it doesn’t rely on a small number of clients. While losing a major customer would hurt, it wouldn’t cripple the business. The company remains focused on attracting new clients after adding to its base last financial year. IRI isn’t particularly expensive when compared to competitors.
Infomedia (IFM)
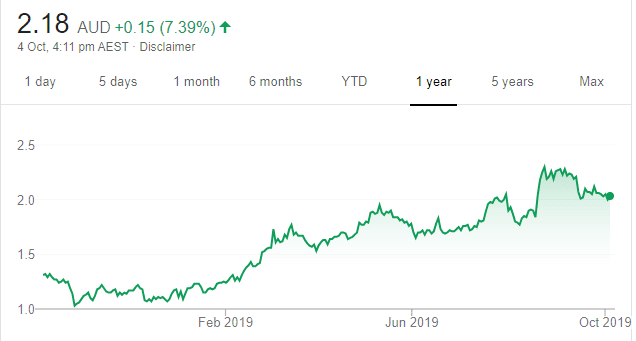
Chart: Share price over the year
The software provider delivered a strong result in fiscal year 2019. Group revenue rose 16 per cent to $84.598 million. Net profit after tax was up 25 per cent to $16.122 million. The final dividend rose 26 per cent to 2.15 cents a share. The outlook is bright, with the company expecting to deliver double digit growth in revenue and earnings in fiscal year 2020. It also has strong recurring revenue.
HOLD RECOMMENDATIONS
Treasury Wine Estates (TWE)
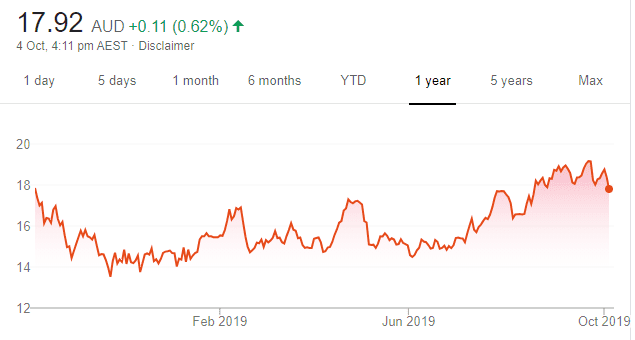
Chart: Share price over the year
The company is focusing on growing market share, particularly through increased premium wine sales. The company has a strong track record. In fiscal year 2019, earnings before interest and tax rose 25 per cent to $662.7 million, while net profit after tax was up 16 per cent to $419.5 million. Earnings per share were up 18 per cent to 58.4 cents. A solid hold.
Clover Corporation (CLV)
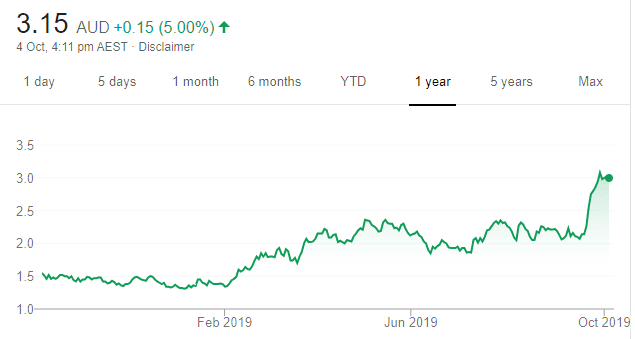
Chart: Share price over the year
The company focuses on improving human health through nutrition. The company delivered a 21.8 per cent increase in sales revenue to $76.7 million for fiscal year 2019. The uptake of DHA (docosahexaenoic acid) and demand for premium infant formula helped drive the result. The outlook was also positive. With governments increasingly legislating the requirement for DHA in infant formula, CLV is well positioned for future growth.
SELL RECOMMENDATIONS
South32 (S32)
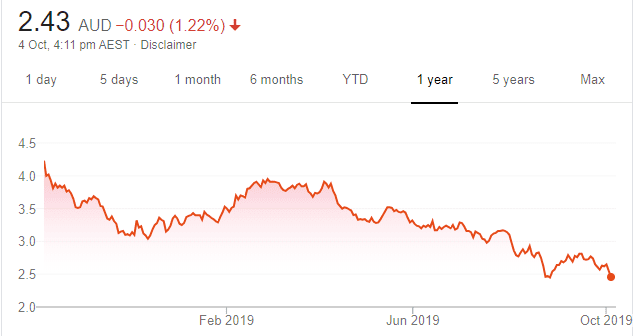
Chart: Share price over the year
We believe the outlook for this metals and minerals company is softer after several analysts downgraded alumina and coking coal price forecasts. The stock has been underperforming BHP and RIO and, in our view, this now looks likely to accelerate.
Sims Metal Management (SGM)
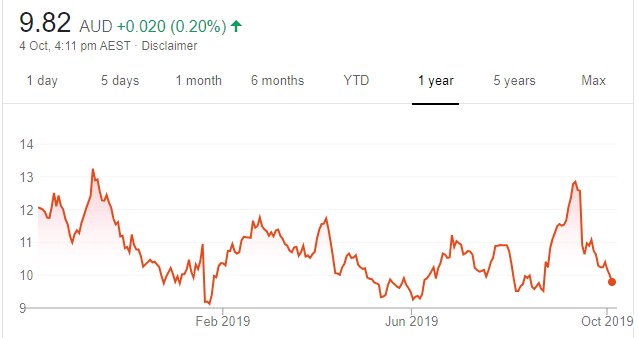
Chart: Share price over the year
Delivered an earnings downgrade for the first half of fiscal year 2020 on the back of significant falls in ferrous and non-ferrous prices. The near term outlook for scrap markets remains weak. The share price has fallen from $12.85 on September 11 to trade at $9.85 on October 3. We see no reason to own this one right now.
Top Australian Brokers
- Pepperstone - multi-asset Australian broker - Read our review
- eToro - market-leading social trading platform - Read our review
- IC Markets - experienced and highly regulated - Read our review

Michael Gable, Fairmont Equities
BUY RECOMMENDATIONS
Santos (STO)
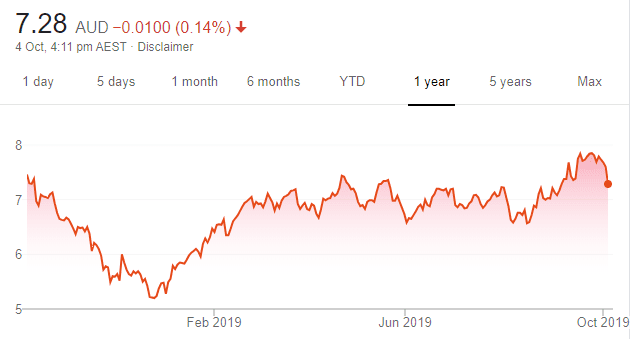
Chart: Share price over the year
Shares in the energy giant broke above a major resistance level prior to the Saudi oil attacks in mid September. The shares have risen from $6.58 on August 7 to trade at $7.275 on October 3. This is a bullish sign and indicates that Santos shares can head higher from here.
Goodman Group (GMG)
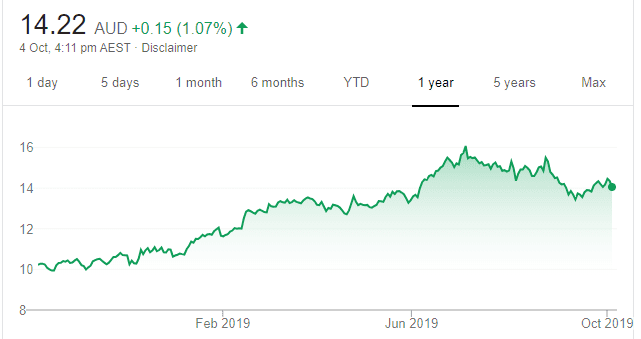
Chart: Share price over the year
Shares in this integrated property group have retreated from a high of $16.10 on July 5 to trade at $14.02 on October 3. We believe the selling has been overdone for a group that reported an 11.4 per cent increase in operating profit to $942 million for fiscal year 2019. We can see some good support coming on the chart. We’re happy to buy at these levels, as we expect GMG to resume its longer term uptrend.
HOLD RECOMMENDATIONS
Cochlear (COH)
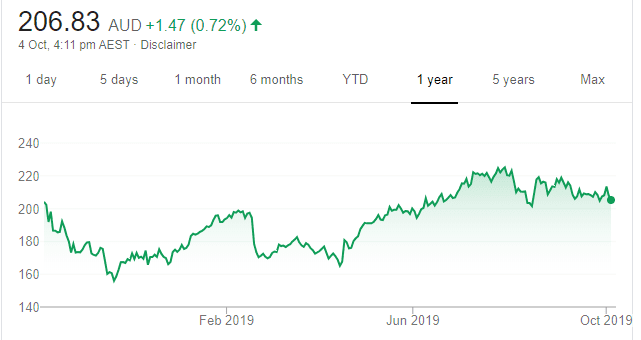
Chart: Share price over the year
The business continues to do well. We expect buying support to continue as this hearing implants maker has shown it can grow in a subdued environment. The company’s charting profile looks attractive, with good support above $200. Recent price action indicates to us that the shares are ready to head higher again. The shares were trading at $203.59 on October 3.
Integrated Research (IRI)
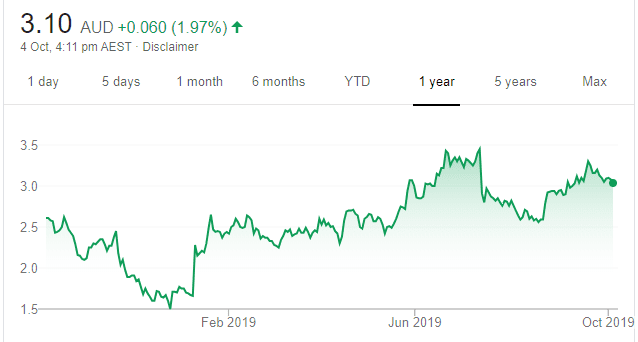
Chart: Share price over the year
Shares in this software provider were oversold in July after the company provided a profit guidance update that fell short of investor expectations. The stock isn’t as expensive as other technology companies and it appears investors are keeping are close eye on performance. Since mid August, the shares have performed well and the price action is looking bullish again. We believe that there is more upside from here.
SELL RECOMMENDATIONS
Insurance Australia Group (IAG)
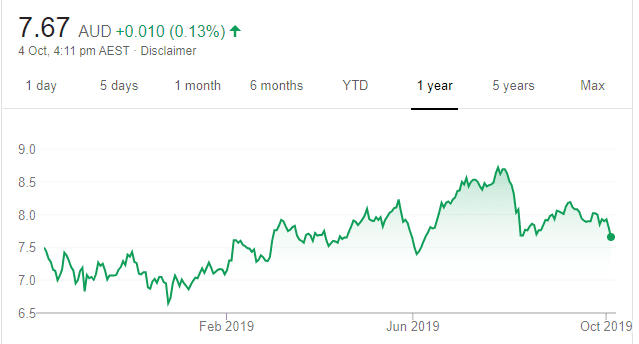
Chart: Share price over the year
The share price was hammered in August, as investors were disappointed with the full year result. The stock has been unable to recover. Price action during the past few weeks continues to look weak and, from a charting perspective, the risk remains to the downside.
The A2 Milk Company (A2M)
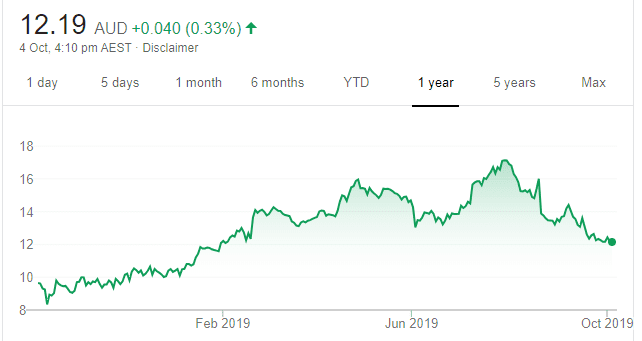
Chart: Share price over the year
Falling below support near $13 in mid September was a negative sign for A2M. Volume on the downside has also picked up, which puts additional selling pressure on the stock. For now, it appears the uptrend is finished. In our view, investors considering buying the stock can afford to be patient and wait for lower levels. The stock was trading at $12.27 on October 3.

David Thang, PhillipCapital
BUY RECOMMENDATIONS
Domino’s Pizza Enterprises (DMP)
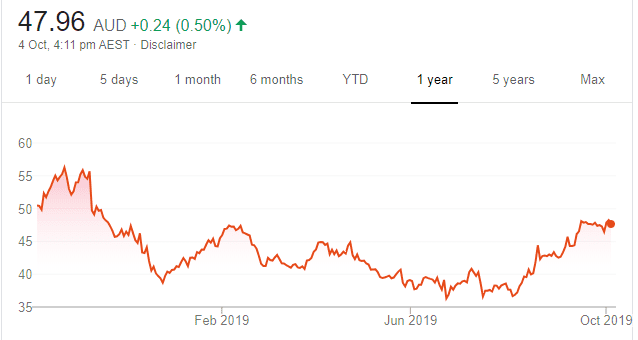
Chart: Share price over the year
Sales in this global pizza chain have grown by around 15 per cent annually during the past five years. We expect growth rates to continue at around 10 per cent annually during the next five years. The forward dividend yield is a respectable 3.1 per cent, which is franked at 86.4 per cent. Combining growth and yield make for a tasty investment recipe.
Reliance Worldwide Corporation (RWC)
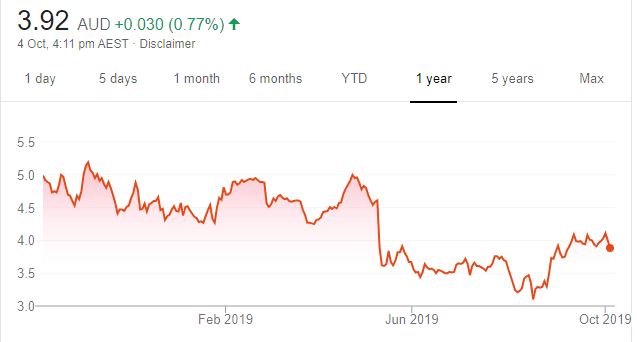
Chart: Share price over the year
We expect this international plumbing products company to enjoy a tailwind on the back of a growing US housing market. We expect housing to peak in 2025. Also, we expect Reliance to expand into new plumbing markets. A weaker Australian dollar enhances bottom line earnings.
HOLD RECOMMENDATIONS
Treasury Wine Estates (TWE)
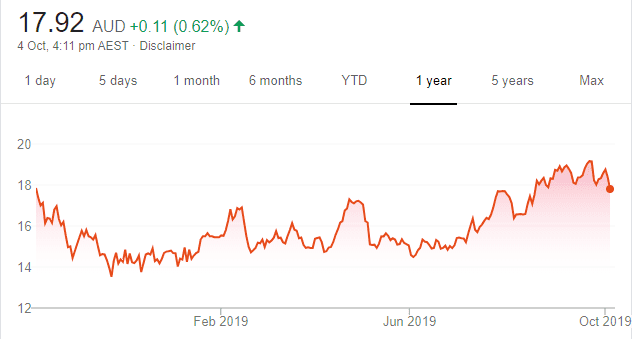
Chart: Share price over the year
A global wine company, with brands including the prestigious Penfolds and Wolf Blass. The company is attractive on valuation grounds, and, as an added bonus, was recently trading on a fully franked dividend yield of 2.60 per cent. Offshore earnings also appeal, with 40 per cent generated in the US, 25 per cent in Asia and 11 per cent in Europe.
Magellan Financial Group (MFG)
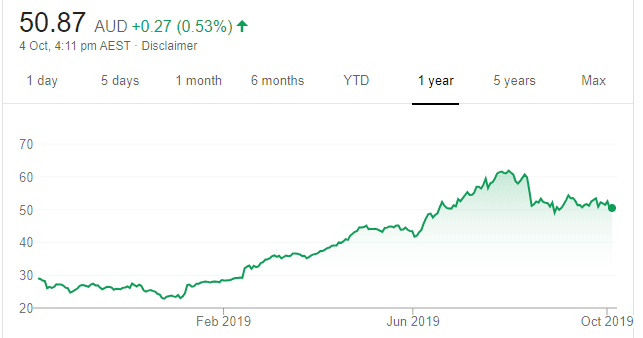
Chart: Share price over the year
This global fund manager has an enviable long term track record in international equities. Further, Magellan’s distribution relationships in the much larger offshore markets of the UK and the US give it a stronger growth profile than most domestic peers.
SELL RECOMMENDATIONS
Bravura Solutions (BVS)
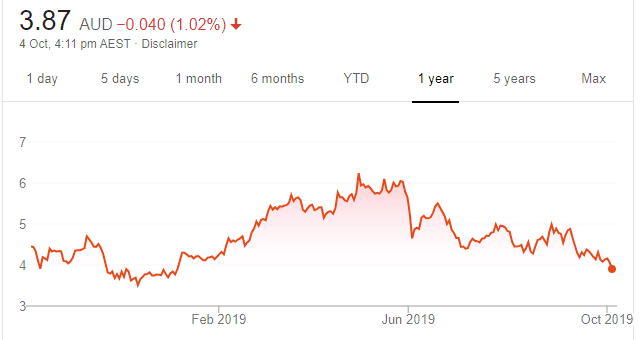
Chart: Share price over the year
The share price of this global software products and services provider to the wealth management and funds administration industries reached a peak of $6.27 on May 1. The software sector has lost favour with investors and BVS shares have since been slashed to trade at $3.965 on October 3. Should the bears remain in control, downside support is expected at the 50 per cent Fibonacci retracement level of $3.68. We believe it’s best to look elsewhere.
Webjet (WEB)
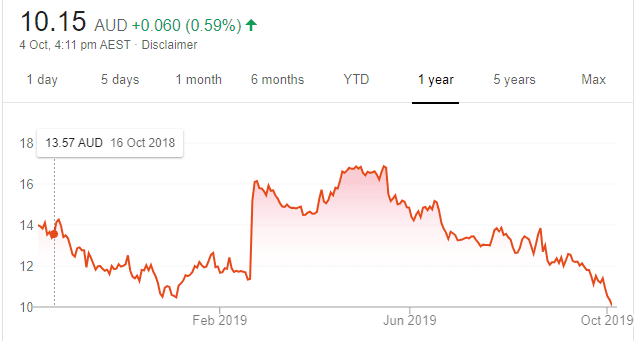
Chart: Share price over the year
This online travel agency operating in Australia and New Zealand has been doing it tough since May. The collapse of customer Thomas Cook is expected to have an impact on fiscal 2020 results. Downward share price momentum remains in play, with a zone of support indicated between $8.89 and $10. We prefer others. The shares were trading at $10.12 on October 3.