
Trading with the Simple Moving Average (SMA)
Moving averages are technical analysis indicators designed to smooth out price movements by determining an average price over a period of time. There are two major types of moving averages in use – the simple moving average (SMA) and the exponential moving average (EMA).
The EMA is considered an improvement by many technical analysts over the SMA as it weighs more recent prices more heavily than older pricing used in the simple moving average. The intent is to be accommodating to newer information.
Top Australian Brokers
- Pepperstone - Trading education - Read our review
- IC Markets - Experienced and highly regulated - Read our review
- eToro - Social and copy trading platform - Read our review
What is The Simple Moving Average?
As its name implies, the simple moving average is nothing more than an arithmetic average over a specific time period.
As an example, the 10 day simple moving average would add together the closing stock price over the past ten days and then divide by ten. Simple moving averages with short time frames tend to respond rapidly to price changes in the stock while simple moving averages over longer time periods are slower to respond to price changes. The time period is at the discretion of the investor employing the simple moving average, making them suitable for both short-term traders and long-term investors. The most commonly used time periods favored by most traders and investors are 10, 20, 50, 100, and 200.
Long term simple moving averages are better at smoothing out volatility in price action than short term simple moving averages. Both point out the price trend of the stock, with a rising simple moving average indicating a stock whose price is on an upward trend. Declining simple moving averages indicate a stock price in decline.
Simple moving averages are available in most online trading platforms and some financial websites stock search function.
How to Trade with Simple Moving Averages
Trading with simple moving averages can employ a single simple moving average or two simple moving averages covering different time frames, one longer than the other.
A single moving average can show a stock in the midst of an upward or downward trend. When the stock price exceeds its simple moving average, it is likely in an upward trend. If the stock price is below the simple moving average it is likely in a downtrend.
Technical analyst experts recommend investors and traders experiment with multiple time frames to verify the trend.
Using multiple simple moving averages of different lengths on the same stock opens more trading possibilities. What investors and traders look for is instances when the averages cross over. With a 50 day simple moving average coupled with a 200 day simple moving average, the death cross occurs when the 50 day SMA crosses below the 200 day SMA, a bearish signal.
A golden cross occurs when the 50 day SMA crosses above the 200 day SMA. The following chart from investopaedia.com provides an example of a death cross.
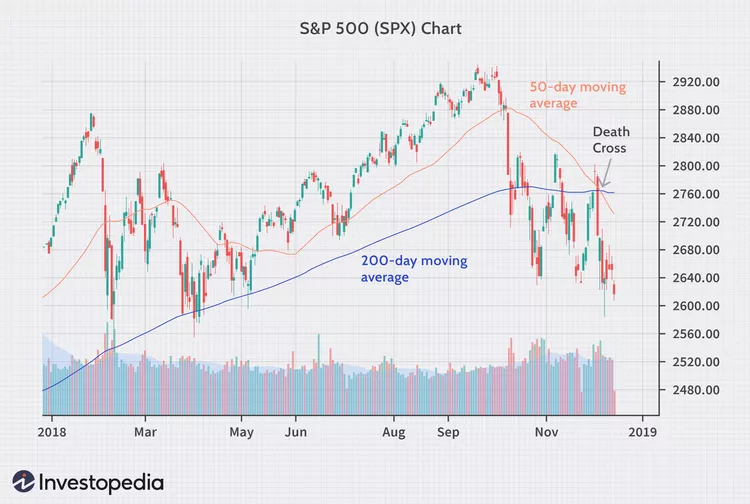
Golden Cross.
Image by Sabrina Jiang © Investopedia 2021
Combining the SMA with Other Indicators
Two technical indicators commonly used with simple moving averages are the relative strength index (RSI) and the moving average convergence divergence (MACD).
The relative strength index measures overbought or oversold conditions using a user-definable scale ranging from 0 to 100. Most investors use a value of 70 to mark overbought conditions and 30 to mark oversold conditions. Some investors prefer the more stringent values of 80 and 20.
When the RSI closely approaches, hits, or surpasses the overbought value many investors see this as a SELL signal. When the RSI approaches, hits, or surpasses the oversold value, many investors view this as a potential BUY signal.
The MACD plots two lines, the MACD line and the signal line. Both lines are calculated from exponential moving averages (EMA). The MACD line subtracts a 26 time period EMA from a 12 time period EMA, The time period is customizable, both in length of the period and the period itself – minutes, hours, days.
The signal line comes from a 9 time period EMA. The MACD line is plotted on top of the signal line. The MACD also spots overbought and oversold conditions as well as spotting BUY and SELL signals from crossovers. Here is an example one year price chart for Commonwealth
Bank of Australia (CBA) using all three indicators.
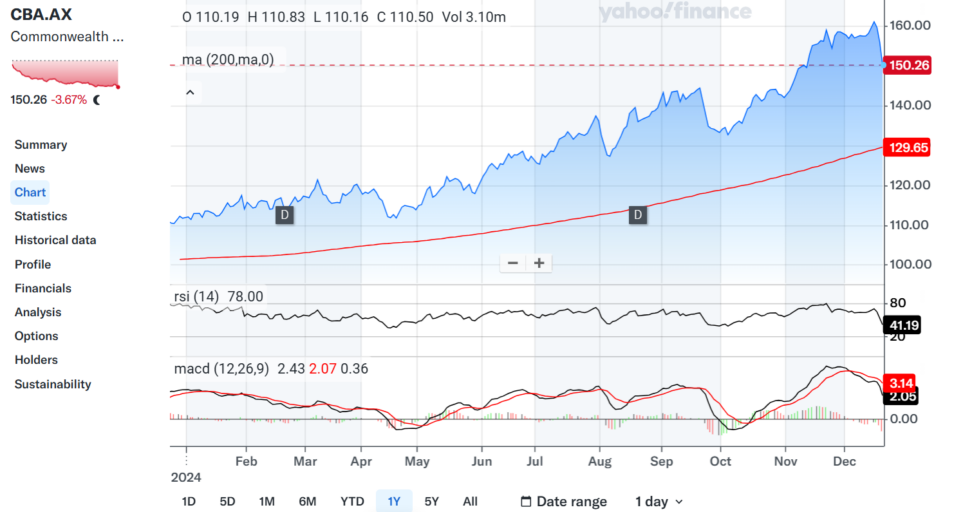
Source: yahoo finance Australia
Crossovers between the MACD line and the signal line are potential trading signals, with bullish signals coming when the MACD line crosses above the signal line and bearish signals coming when the MACD line falls below the signal line.
The MACD indicator also provides investors and traders with a histogram appearing at the bottom of the chart. This histogram is a visual representation of the difference between the MACD line and the signal line allowing traders and investors to quickly spot converging or diverging lines and crossover.
The Drawbacks of the SMA
No technical indicator is fool proof. Simple moving averages have several drawbacks.
Since the SMA relies on historical data, the indicator earns the moniker of a lagging indicator, delaying potential trading signals.
Second, SMAs lose accuracy in market conditions of high volatility, missing rapid changes in conditions, both with the stock under analysis and in the market as a whole.
Third, unexpected and sudden changes in price movements are not likely to help traders and investors due to the indicator’s slow response.
Fourth, explosive price changes suggest investors and traders should rely more on longer-term time periods, given the indicators inherent tendency to respond slowly. The 200 day moving average smooths out price action over a longer period, avoiding the pitfall of short-term rapid rises that prove transitory. The 200 day simple moving average is favored by most professional investors.
Divergence and the SMA
Divergence in stock trading happens when the stock price of a stock under analysis moves in the opposite direction of the technical indicator employed. Divergence when using a simple moving average happens when the price and the SMA move in opposite directions. Many traders use other indicators, like the RSI to spot divergence. The following chart from investopaedia.com provides an example.
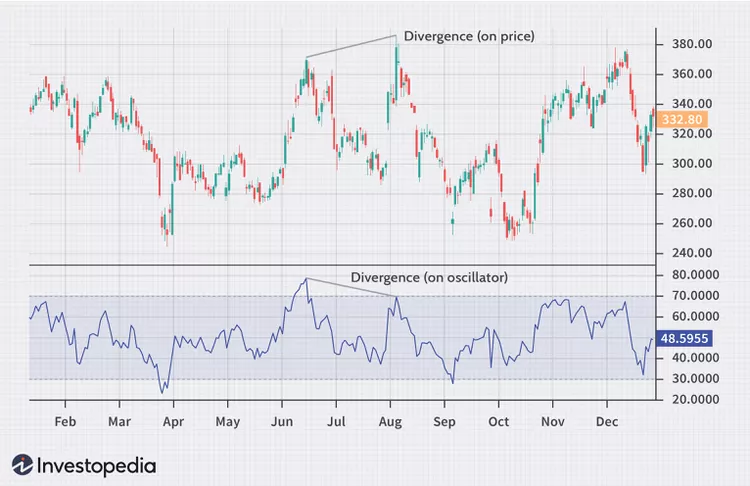
Image by Sabrina Jiang © Investopedia 2021
Simple moving averages(SMA) are technical indicators allowing investors of all stripes to assess up trending and down trending price action of stocks under analysis. SMAs are calculated by adding the closing price of the stock over the time period set by the user and then dividing the result by the time period.
To trade using simple moving averages, technical analysis experts strongly recommend using additional indicators like the RSI and the MACD. The major drawback of these indicators is their reliance on historical data.