
Benefiting from Trading in Trending Markets
One of the most famous quotes about stock market investing reportedly came from legendary investor Jesse Livermore – famous as a pioneer of day trading — who said, “the trend is your friend!” Years later what may be a matter of urban legend has it that Martin Zweig – another of history’s notable investors — expanded the quote – “the trend is your friend until the end when it bends.”
Right now the bull market trend climbing higher since 2022 is bending, with the real possibility of a full blown bear market on the horizon. Historically, stock markets have moved in upward or downward movement consistently, interrupted often by periods of flat or sideways movement.
Individual stocks and business sectors also have historically moved in upward, downward, or sideways movements.
Trend investing has long been a favored investing strategy for momentum investors looking for short-term profits and long-term investors looking for bargains in down trending markets.
Top Australian Brokers
- Pepperstone - Trading education - Read our review
- IC Markets - Experienced and highly regulated - Read our review
- eToro - Social and copy trading platform - Read our review
Trend-Following Systems Explained
Trend following is like riding the waves in surfing. Investors follow the trend, buying quality stocks rising on their own or in a sector or market uptrend, and selling or shorting in stock, sector, or market downtrends.
Some cynics may claim the herd mentality creates and drives trends. There may be some truth there, given that in roaring bull markets mediocre stocks rise along with best of breed companies. The adage that a rising tide lifts all boats can apply to market tides, adding that falling tides lower all boats.
The adage that a rising tide lifts all boats can apply to market tides, adding that falling tides lower all boats.
Either way, upwards, downward, and sideways trends in markets are real. For investors transitioning from trend following to trend trading, the critical question is how do you identify a trend, both at the start and at the end.
Identifying Trends
Trends in place can be identified by their pattern of high and low prices in daily trading. In an uptrend a stock will keep making higher highs, but also higher lows. The reverse is true in downtrends, where the stock price will continue to make lower lows along with lower highs for the day.
Although trend following is considered a technical analysis strategy since it tracks price movements, fundamental analysis inclined investors can apply that system to potential targets to gauge whether or not that “boat” deserves to be rising or is rising artificially with the tide.
At a basic level, any retail investor can chart a trendline, using a candlestick price movement chart. Here is a simple example of an uptrend line from the website tabtrader.com:
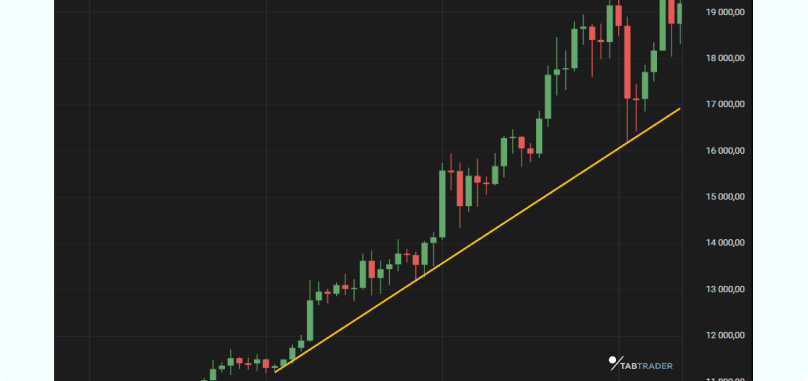
Source: /tabtrader.com/academy/articles/what-is-a-trendline
The trendline at the bottom of the chart is called the support level. Drawing a line along the tips of the candlesticks would produce a resistance level. What the price action is telling investors is that the price has a floor of support below which it has not gone and a resistance ceiling above which the price has not gone.
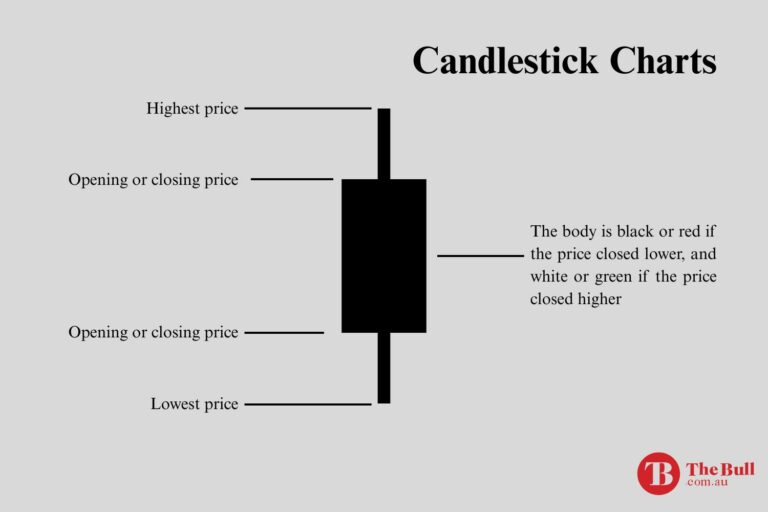
Candlestick charts graphically display the opening and closing price of a stock along with the day’s high and low enabling the identification of both uptrends and downtrends. The following graphic explains:
Breaking through support or resistance does not always guarantee a trend reversal. Experienced technical analysts looks for confirmation from other indicators desgined to gauge the momentum of the trend.
Technical analysis can get overly complicated with numerous examples of trendlines used by sophisticated technical analysis inclined investors. There are a multitude of technical indicators available from most financial websites that allow retail investors to push a few buttons and produce a chart for the stock of their choice complete with technical trend indicators.
There are some “entry level” trend following indicators that can help average retail investors to develop a trend-following strategy.
Trend-Following Indicators
Moving averages are calculated over a period of time using the closing stock price of each day in the period. Simple moving averages add the closing values and divide by the number of days. Exponential moving averages weight the most recent closing prices higher than the prices posted at the beginning of the time period in the analysis, making them more responsive to recent price movements.
The following price movement chart from the ASX website displays the SMA over a twenty day period and the EMA for Woolworths (ASX: WOW) over a fifty day period. If the lines crossover, it may be a sign of a reversal.
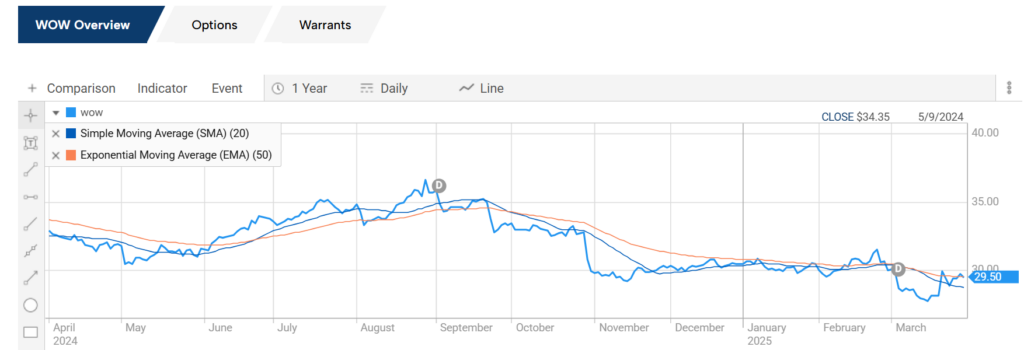
Source: ASX Website
Trend reversals are signaled when the moving average lines cross over. In the WOW chart, we see a “Death Cross” when the shorter moving average crosses below the longer moving average. The chart shows one of the shortfalls of trend following as the reversal had begun before the lines crossed over.
There are a host of complicated variations of moving average trend indicators, including the popular MACD (moving average convergence divergence). There is one simple indicator that is easy to understand – the Relative Strength Index (RSI).
The RSI is momentum indicator that measures the speed and change of price movements on a scale of 0 to 100. The RSI rising above 70 is a possible SELL signal as he stock price has entered overbought territory. The RSI falling below 30 is a possible BUY signal as the stock has entered oversold territory.
On the WOW chart from the ASX we have added the RSI, found under the indicator tab at the top of the chart.
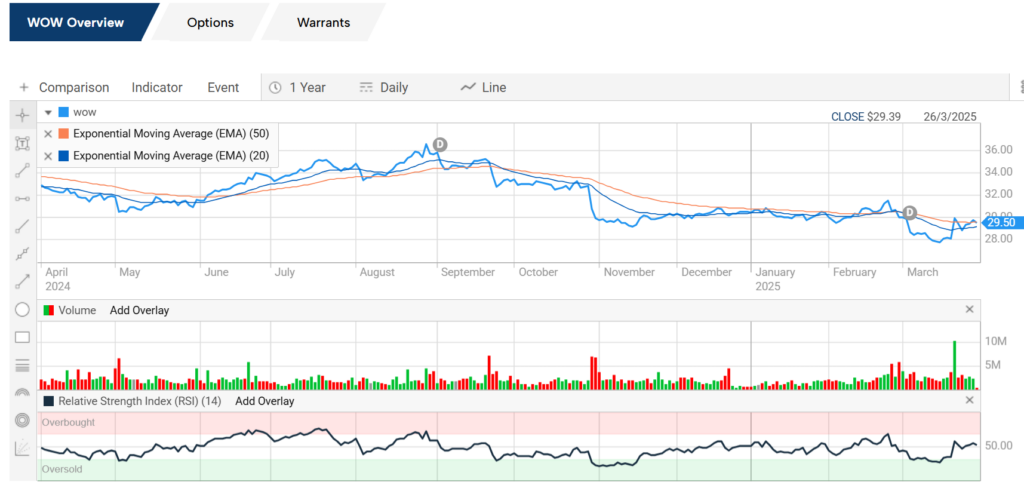
Source: ASX
With moving averages, a bullish cross occurs when the shorter average crosses above the longer, as happened it late June and the price did trend upward after. The RSI caught the same movement. The RSI caught the death cross a bit sooner than the moving averages.
These indicators are readily available from most financial websites with the system doing the math for you. It is possible to build a trend following investing strategy with these simpler indicators. However, no indicator, no matter how complex is foolproof.
Counter-Trend Trading
In counter trend trading, the investor moves in the opposite direction of the herd, looking for opportunities by price corrections that do not result in full-blown trend reversals. The WOW chart is an example
Some traders would employ more indicators in an attempt to better determine if the price movement is a temporary correction or the start of a new trend. The counter trader looks to make a short term gain form the correction and exit quickly. Counter trading is not for the faint of heart and is best left to highly experienced technical traders who can better analyze the price action to differentiate between a price correction and a trend reversal.
Investors employing trend following strategies go with the flow and look to buy stocks in an uptrend and sell or short stocks in a downtrend. The challenge is to try to determine when the market or an individual stock or business sector is about to reverse trend. There are technical indicators that although not fool proof, can help analyse the strength and momentum of trends.