Justin Klimas, Wilsons
BUY RECOMMENDATIONS
Rural Funds Group (RFF)
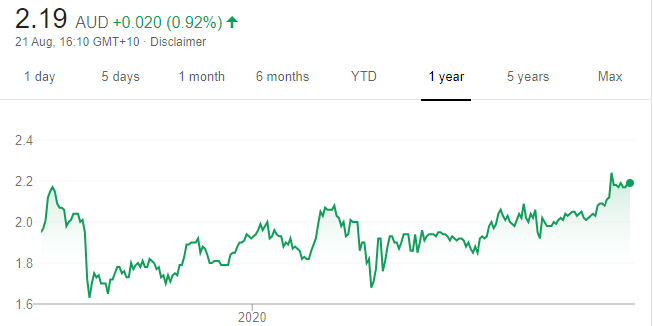
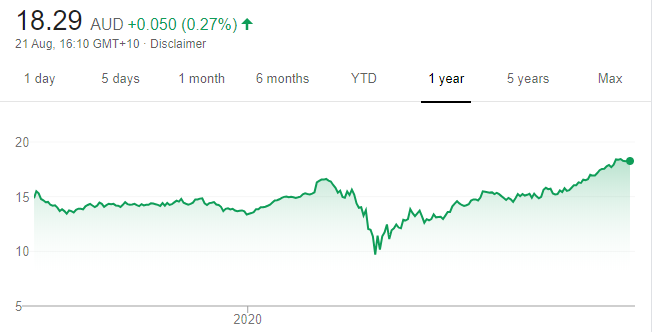
Chart: Share price over the year
Owns a portfolio of agricultural assets. The group recently entered into an $81 million contract to acquire sugar cane farms and water entitlements from MSF Sugar. The group plans to convert the farms to macadamia orchards and cropping land. RFF is experienced with macadamia orchards. Greenfield almond orchard development has also been successful. The growth potential from the acquisition is attractive. We retain an overweight rating.
Opthea (OPT)
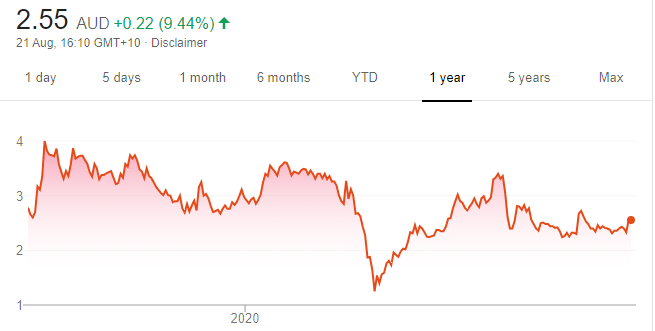
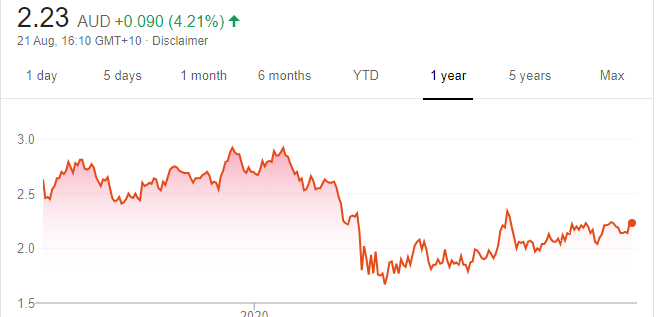
Chart: Share price over the year
The company has been compiling clinical evidence in support of treating retinal disease during the past four years. Its technology is in phase II clinical trials, with phase III trials scheduled for 2021. Trial data to date has provided encouraging results, in our view. OPT technology may attract a major strategic partner. We retain an overweight rating.
HOLD RECOMMENDATIONS
Pinnacle Investment Management Group (PNI)
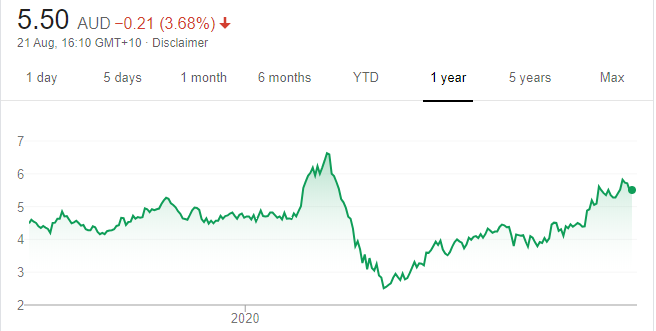
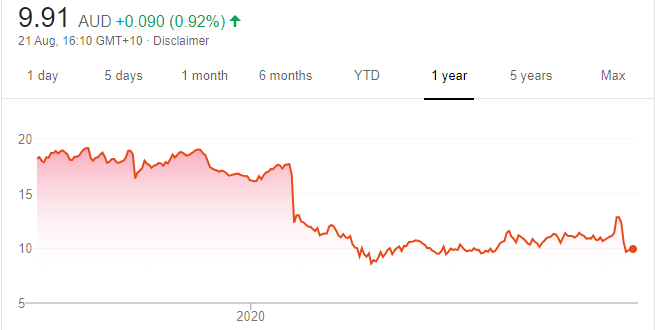
Chart: Share price over the year
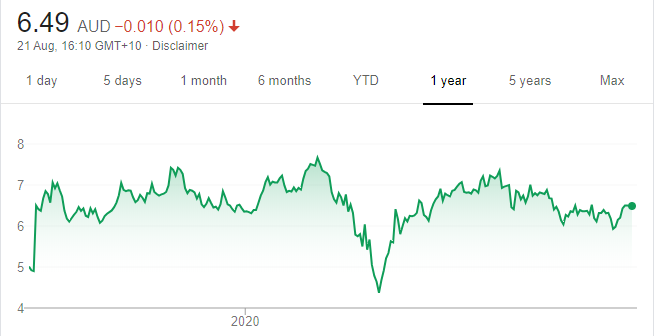
Net profit after tax of $32.2 million for fiscal year 2020 was up 5.6 per cent on the prior corresponding period. The result was in line with expectations, as an increase in performance fees offset subdued growth in funds under management. Pinnacle is well managed. Its model of partnering with specialist investment managers should continue to be rewarding over the longer term. We retain a market weight rating.
Monadelphous Group (MND)
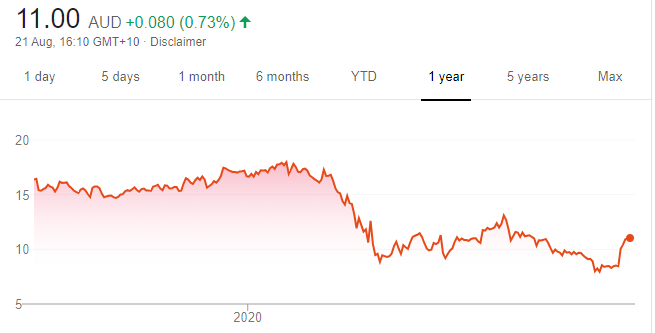
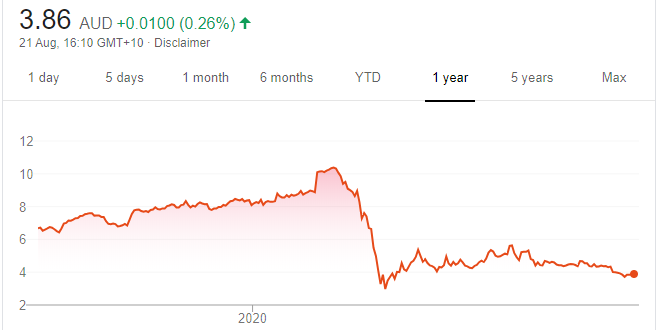
Chart: Share price over the year
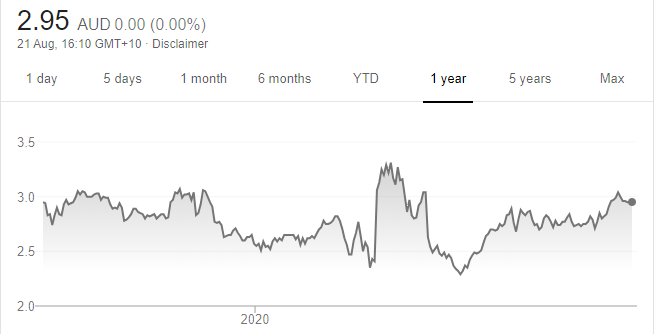
This engineering group faces several challenges caused by delays in construction projects, as a result of COVID-19. However, the company is well positioned to navigate this difficult period due to its solid operational track record and net cash balance sheet. Iron ore and copper price resilience provides support. We retain a market weight rating.
SELL RECOMMENDATIONS
Breville Group (BRG)
Chart: Share price over the year
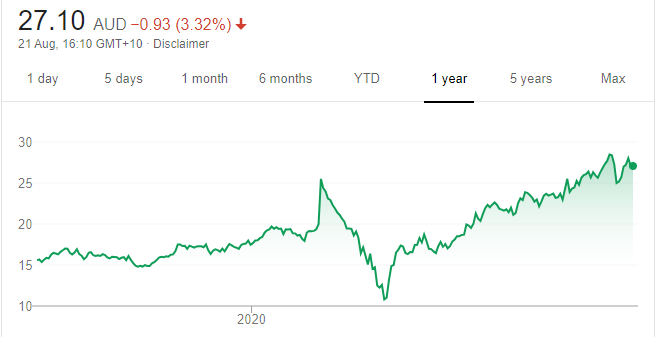
The kitchenware company reported a sound full year result, with normalised earnings before interest and tax increasing 14.3 per cent in line with expectations. However, the share price has more than doubled since the March lows and, in our view, is now over priced at these levels. While the company is poised to keep growing, we can’t see it justifying a lofty price/earnings multiple of about 50 times on August 20. We retain an underweight rating.
Nanosonics (NAN)
Chart: Share price over the year
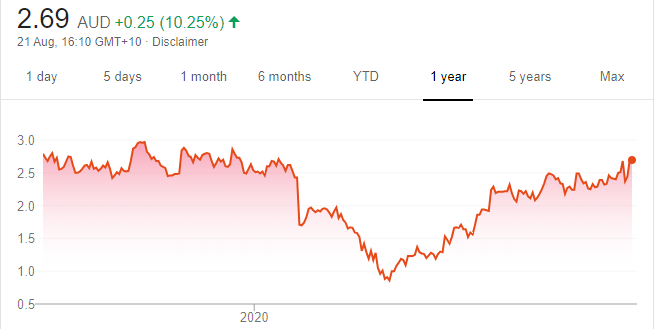
The company’s trophon EPR ultrasound probe disinfector is a success. But sustaining sales to hospitals may be challenging in the absence of demonstrating the equipment to senior hospital management due to COVID-19. NAN is about to launch a new product, but we believe the market has factored too much value into it and the company’s share price. We retain an underweight rating.
Top Australian Brokers
- Pepperstone - multi-asset Australian broker - Read our review
- eToro - market-leading social trading platform - Read our review
- IC Markets - experienced and highly regulated - Read our review
Julia Lee, Burman Invest
BUY RECOMMENDATIONS
Nearmap (NEA)
Chart: Share price over the year
Nearmap provides high quality aerial imaging used by councils, planners, builders and engineers. COVID-19 has accelerated demand for digital products. Often a rise in a company’s valuation is due to a new product, strategy or management team. With Nearmap, it has recently launched an artificial intelligence offering. This provides an exciting new avenue for growth, in our view. We hold NEA in our Australian concentrated shares fund.
Metcash (MTS)
Chart: Share price over the year
Its supermarket, liquor and hardware businesses have been outperforming in 2020 due to an increasing number of people working from home, or improving their homes. The strong hardware trend is at risk due to an upcoming reduction in Federal Government stimulus payments. But we expect the solid trend in food and liquor to continue. Metcash is also benefiting from people choosing to shop locally or online. Trends such as these tend to be sticky to the advantage of Metcash. We hold MTS in our Australian concentrated shares fund.
HOLD RECOMMENDATIONS
Goodman Group (GMG)
Chart: Share price over the year
Goodman Group owns, develops and manages industrial properties. It has a strong development pipeline. GMG is benefiting from increasing demand for more warehouses due to a distinct shift to online shopping in 2020. GMG operates a strong business. The share price has enjoyed a solid run, rising from $10.16 on March 23 to close at $18.24 on August 20.
South32 (S32)
Chart: Share price over the year
South32 is a diversified miner, producing aluminium, alumina, manganese, nickel, silver and coal. S32 is looking to optimise its portfolio by divesting non-core assets. It recently agreed to divest its Tasmanian Electro Metallurgical Company subject to approval from the Foreign Investment Review Board. S32 remains well placed to benefit from a Chinese recovery. But the prices of key commodities need to rise to potentially avert the risk of a downgrade in consensus forecasts.
SELL RECOMMENDATIONS
Treasury Wine Estates (TWE)
Chart: Share price over the year
China’s Ministry of Commerce announced it had begun an anti-dumping investigation into wine imports from Australia. The investigation comes at a time when there’s an oversupply of wine in the US. The company reported a 25 per cent fall in net profit after tax to $315.8 million for fiscal year 2020.
Challenger (CGF)
Chart: Share price over the year
Challenger is Australia’s largest provider of annuities. The latest result demonstrates difficult conditions in annuity sales, with the old vertically integrated model unwound by the big banks. That has led to a near $1 billion fall in annuity sales. Add life insurance margin headwinds into the mix and the outlook remains difficult.
Tony Locantro, Alto Capital
BUY RECOMMENDATIONS
BetaShares Australian Equities Strong Bear Hedge Fund (BBOZ)
Chart: Share price over the year
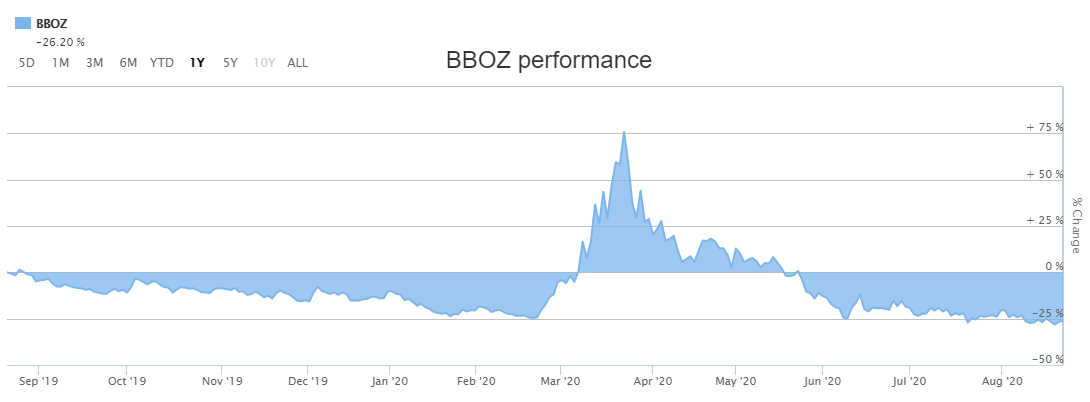
This exchange traded fund aims to produce returns that are negatively correlated to the returns of the S&P/ASX Accumulation 200 Index. A fall of 1 per cent in the index can deliver an increase of between 2 per cent and 2.75 per cent in the value of the fund. We believe the S&P/ASX 200 index is over valued, as it doesn’t appear to take into account economic headwinds and financial stresses associated with Victoria’s lockdown.
BetaShares US Equities Strong Bear Hedge Fund – Currency Hedged (BBUS)
Chart: Share price over the year
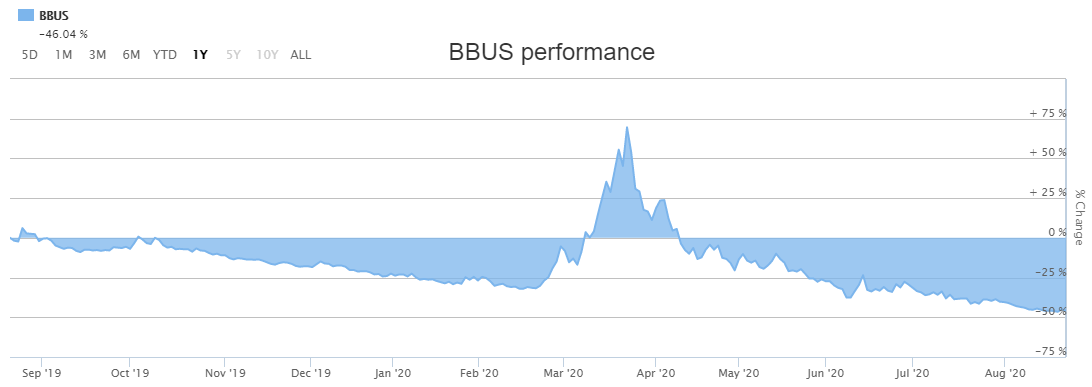
This exchange traded fund tracks the performance of the US stock market. A fall of 1 per cent in the US market can deliver an increase of between 2 per cent and 2.75 per cent in the value of the fund. In our view, the US market recovery appears to be overbought. This ETF provides insurance against a declining market. During the COVID-19 capitulation, this fund performed strongly.
HOLD RECOMMENDATIONS
Dimerix (DXB)
Chart: Share price over the year
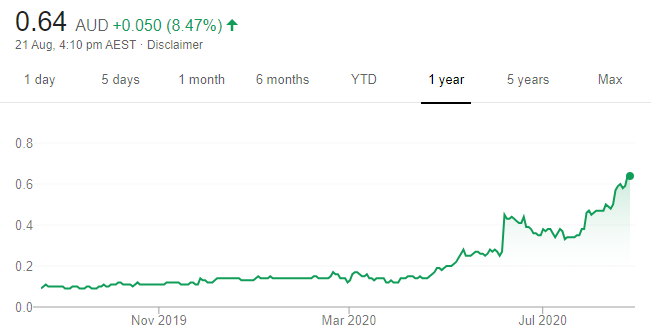
DXB is a clinical stage drug development company. DXB has recently been a strong market performer after announcing top line positive results in a phase 2a clinical study of DMX-200, a lead candidate for treating a rare kidney disorder. Results from a phase 2 study into chronic kidney disease are expected in coming weeks.
Proteomics International Laboratories (PIQ)
Chart: Share price over the year
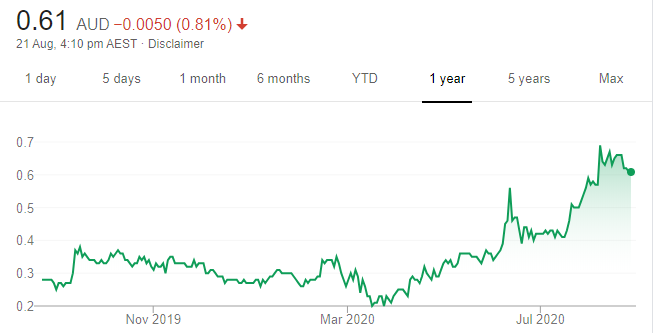
The company’s PromarkerD is a predictive test for diabetic kidney disease. PromarkerD may soon generate revenue, with clinical risk mitigated. PIQ is also in the early stages of developing a test for endometriosis that affects an estimated one in nine women. We believe PIQ represents a growth opportunity.
SELL RECOMMENDATIONS
Marley Spoon AG (MMM)
Chart: Share price over the year
The company delivers fresh ingredients and recipes to the door. Lockdowns in Australia, Europe and the US have lifted demand for its ingredients, as more people cook from home. The company’s share price has risen from 33.5 cents on March 19 to close at $3.08 on August 20. The food delivery market is ultra competitive, so investors may want to consider taking a profit.
Rio Tinto (RIO)
Chart: Share price over the year
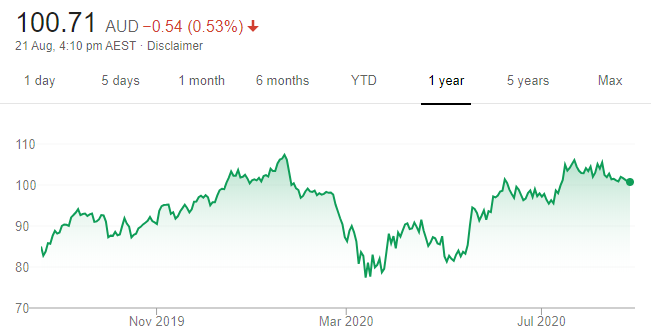
The global miner’s share price has performed well, rising from $80.52 on March 19 to finish at $101.25 on August 20. A strong iron ore price, supply disruptions in Brazil and demand from China have contributed to the share price rise. But going forward, we expect the iron ore price may be pressured given global economic uncertainty flowing from COVID-19. Risks are to the downside, in our view, so investors can consider taking profits.
The above recommendations are general advice and don’t take into account any individual’s objectives, financial situation or needs. Investors are advised to seek their own professional advice before investing. Please note that TheBull.com.au simply publishes broker recommendations on this page. The publication of these recommendations does not in any way constitute a recommendation on the part of TheBull.com.au. You should seek professional advice before making any investment decisions.


