Tom Bleakley, BW Equities
BUY RECOMMENDATIONS
Pro-Pac Packaging (PPG)
Chart: Share price over the year
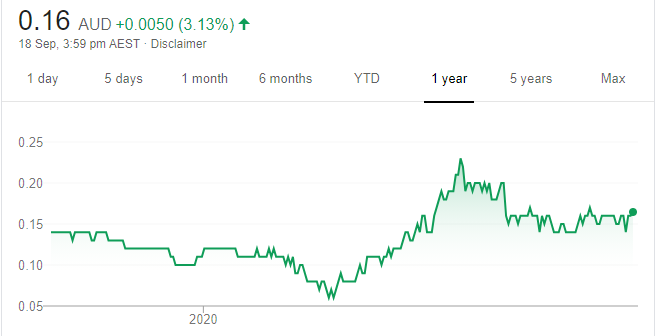
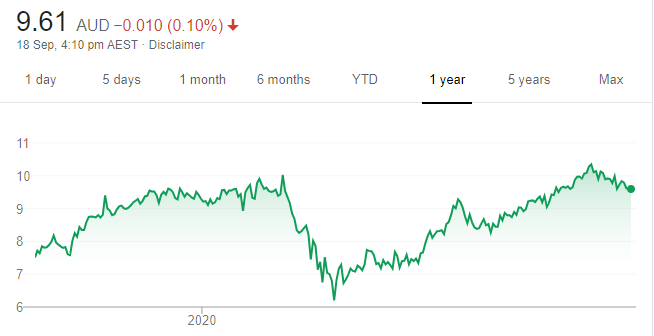
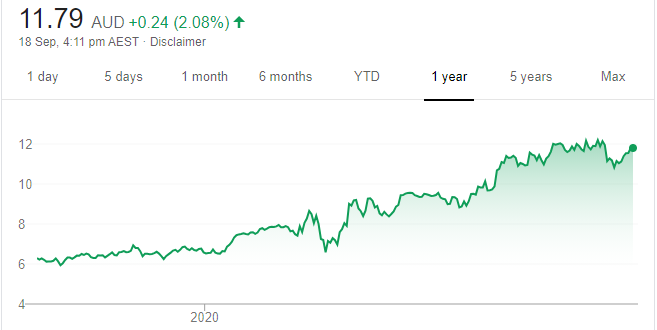
This packaging business has successfully executed a shift towards higher margin products. It reported operating free cash flow of $42.8 million in fiscal year 2020 compared to $26 million in fiscal year 2019. Net debt was down 44 per cent to $46.1 million. We consider PPG a value stock, as the company has demonstrated it can repay debt and increase margins. I own shares in PPG.
Webjet (WEB)
Chart: Share price over the year
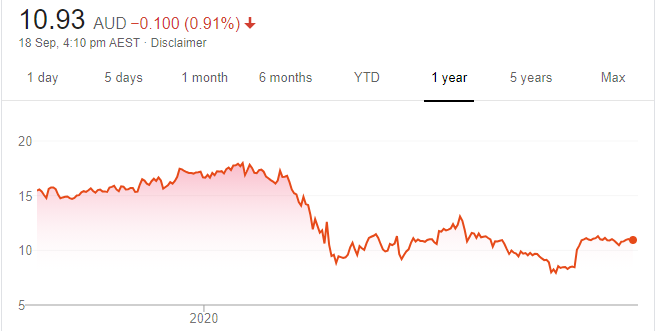
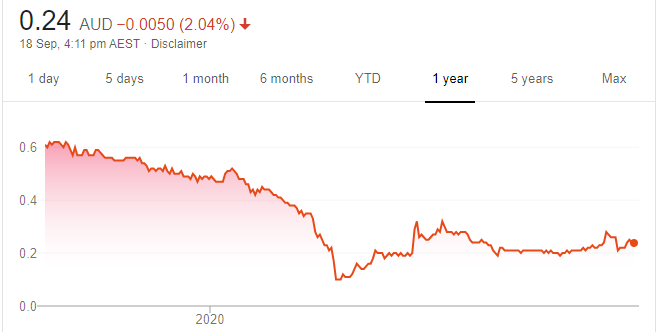
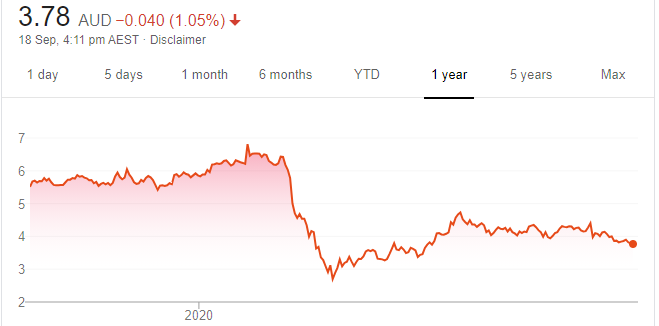
There are signs of pent up demand for leisure travel within Australia. Lockdown restrictions are easing in regional and country Victoria and more gradually in Melbourne. This paints a brighter tourism outlook for this online travel agency. Looking forward two years, we believe WEB represents good buying at current prices. The 52-week high was $10.623 on January 24. The shares closed at $3.90 on September 17.
HOLD RECOMMENDATIONS
Monadelphous Group (MND)
Chart: Share price over the year
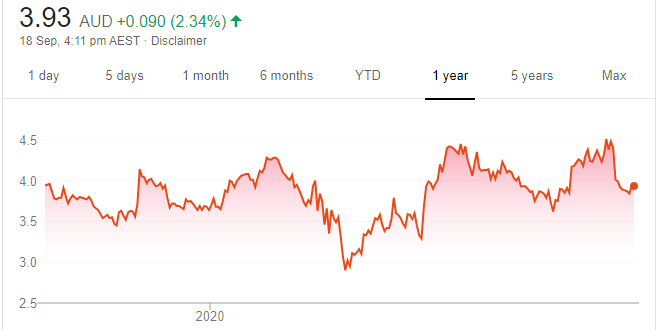
This engineering company recently announced it had secured construction and maintenance contracts in the resources sector with a combined value of about $120 million. New and existing construction projects provide a tailwind in fiscal year 2021. Iron ore prices have remained elevated for longer than expected, increasing activity in the sector. We advise investors to keep a close eye on Rio Tinto’s damages claim of $493 million against MND following a fire at a port facility in January.
Afterpay (APT)
Chart: Share price over the year
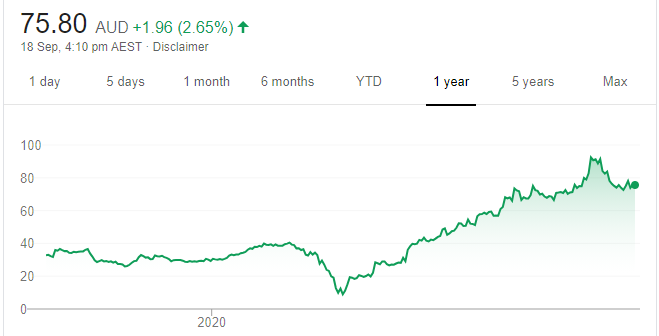
Shares in this buy now, pay later company have soared this calendar year since its 52-week low of $8.01 on March 23. The shares reached a 52-week high of $95.97 on August 27. Share prices of companies in the buy now, pay later sector fell on news that global payments giant PayPal plans to launch a competitive product in the US. APT will have to execute an almost faultless strategy to sustain its growth. APT shares finished at $73.84 on September 17.
SELL RECOMMENDATIONS
GrainCorp (GNC)
Chart: Share price over the year
An expected bumper winter grain crop across eastern Australia could be a bitter outcome for this international agribusiness. A long term insurance derivative means GNC could pay $15 a tonne if the east coast winter crop exceeds 19.3 million tonnes to a ceiling of about 24 million tonnes. We expect the crop to be above 24 million tonnes. Consequently, this could potentially impact GNC’s profit.
Treasury Wine Estates (TWE)
Chart: Share price over the year
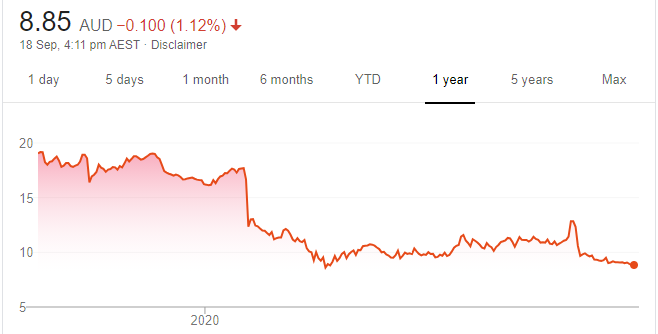
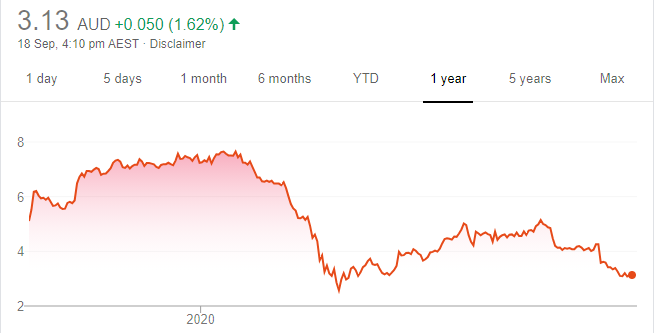
The winemaker faces challenges. China’s Ministry of Commerce announced it had begun an anti-dumping investigation into wine imports from Australia. TWE’s on-premise customers are holding higher inventories due to COVID-19 restrictions. Net profit after tax was down 25 per cent to $315.8 million in fiscal year 2020. There’s too much short-term uncertainty, so investors may want to consider reducing holdings in TWE.
Top Australian Brokers
- Pepperstone - multi-asset Australian broker - Read our review
- eToro - market-leading social trading platform - Read our review
- IC Markets - experienced and highly regulated - Read our review
Peter Day, Sequoia Wealth Management
BUY RECOMMENDATIONS
CSL (CSL)
Chart: Share price over the year
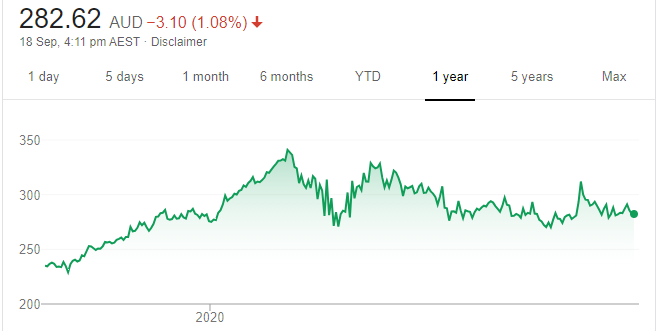
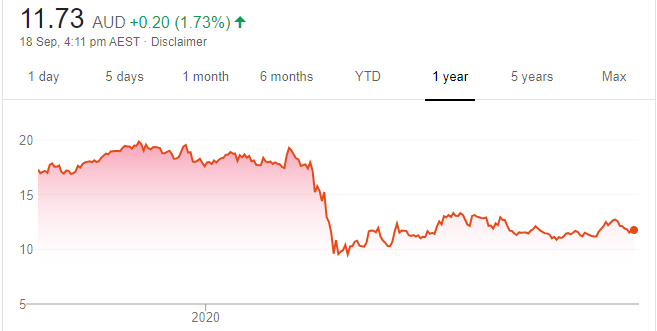
A slowdown in plasma collections began in February in response to COVID-19. We anticipate collections will return to normal from October 2020. We believe demand for plasma products remains robust, particularly for illnesses, such as cancer. We believe growth will continue for several years. Shares in this blood products group finished at $285.72 on September 17.
Bega Cheese (BGA)
Chart: Share price over the year
More favourable weather conditions across most dairy regions present an improved outlook. BGA is progressing with its significant cost reduction program, which should improve efficiencies in 2021/22. BGA’s debt reduction program improves the company’s financial position, which is important given additional industry consolidation opportunities.
HOLD RECOMMENDATIONS
Viva Energy Group (VEA)
Chart: Share price over the year
A Victorian trading update shows fuel volumes in the Coles alliance network are holding above 50 million litres a week, and its commercial operations remain resilient. Its Geelong refining business is operating at reduced production levels due to planned maintenance and the impact of COVID-19 on fuel demand. Consider holding for further updates.
Iluka Resources (ILU)
Chart: Share price over the year
Iluka has released a demerger implementation scheme for Deterra Royalties. The company’s received a favourable draft class ruling from the Australian Tax Office for demerger tax relief. As updated at the interim result, ILU will retain a 20 per cent interest in Deterra. ILU says the demerger has the potential to unlock value for investors. Shareholders will vote on the demerger at an extraordinary general meeting on October 16.
SELL RECOMMENDATIONS
Myer Holdings (MYR)
Chart: Share price over the year
Chief executive John King is progressing a sound turnaround strategy at the department store giant. Optimising space, cutting the cost of doing business and prudently preserving cash are among some of the initiatives. However, due to COVID-19, the retail environment remains challenging and, in our view, the shape of the recovery remains uncertain.
Swick Mining Services (SWK)
Chart: Share price over the year
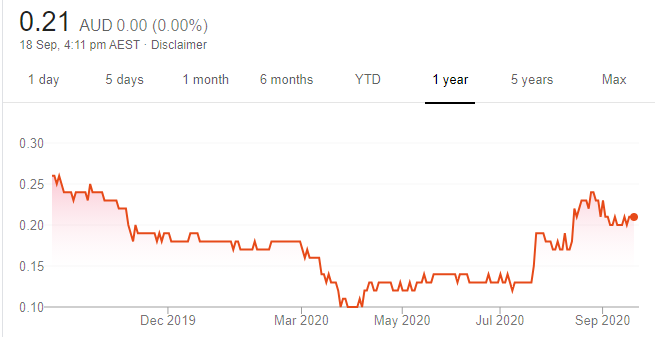
The underground drilling specialist’s order book is supported by new and extended contracts secured in fiscal year 2021. Included among the contracts is BHP’s Olympic Dam mine and Northern Star Resources’ Jundee gold operations. Group EBITDA in fiscal year 2020 fell 17.8 per cent to $21 million. The shares finished at 21 cents on September 17. Investors can consider taking profits.
Luke Pavone, Broadbent Financial
BUY RECOMMENDATIONS
Lendlease Group (LLC)
Chart: Share price over the year
This global project management and construction giant plans to ramp up its external funds under management. We understand the target is about $100 billion within eight years. This, in turn, should increase predictable annuity style earnings that we believe should drive a re-rating of its share price.
NextDC (NXT)
Chart: Share price over the year
This data provider continues to expand its number of sites. It recently reported underlying EBITDA growth of 23 per cent to $104.6 million in fiscal year 2020. Fiscal year 2021 guidance is for underlying EBITDA to range between $125 million and $130 million. We expect demand for cloud based solutions to strengthen in response to more people working from home.
HOLD RECOMMENDATIONS
Link Administration Holdings (LNK)
Chart: Share price over the year
Provides a technology platform connecting investors with their assets. It has relatively high fixed costs that are difficult to reduce during times of lower revenue impacting its profits. Its earnings should improve in fiscal year 2022 and we prefer to hold and wait for a swing in momentum.
Treasury Wine Estates (TWE)
Chart: Share price over the year
The share price has suffered following a disappointing fiscal year 2020 result and China’s Ministry of Commerce announcing an anti-dumping investigation into wine imports from Australia. Much of the bad news may be factored into the share price, so the stock could gradually recover once a clearer picture emerges on the outlook for trade.
SELL RECOMMENDATIONS
IOOF Holdings (IFL)
Chart: Share price over the year
The proposed acquisition of MLC Wealth will make IFL the biggest established retail wealth manager in Australia. However, in our view, this transaction of bedding down MLC with IFL’s existing operations involves significant execution risk. The retail wealth management space is a difficult sector to play, as it’s exposed to regulatory changes.
AGL Energy (AGL)
Chart: Share price over the year
AGL operates Australia’s largest energy portfolio. Lower wholesale electricity prices and government initiatives to reduce residential and commercial utility bills present challenges. The wholesale price cycle appears to be at a low, but a recovery may take time and retail competition is fierce.
The above recommendations are general advice and don’t take into account any individual’s objectives, financial situation or needs. Investors are advised to seek their own professional advice before investing. Please note that TheBull.com.au simply publishes broker recommendations on this page. The publication of these recommendations does not in any way constitute a recommendation on the part of TheBull.com.au. You should seek professional advice before making any investment decisions.


