See our brand new top 10 broker reviews. Find your perfect platform!
Michael Gable, Fairmont Equities
BUY RECOMMENDATIONS
AMP (AMP)
Chart: Share price over the year
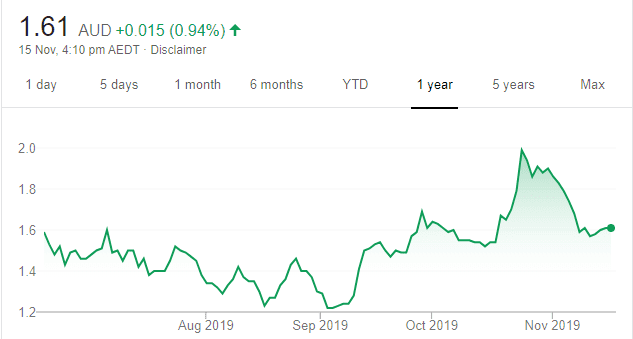
The financial services giant appears to have found and left a new low. The share price has risen from $1.60 on October 9 to trade at $1.975 on November 14. We believe it will trend higher – at least in the short term and in the absence of any more bad news. Investors may want to consider accumulating a parcel of shares for a longer term turnaround. AMP investors have been punished in the past, so the stock carries risk.
Cochlear (COH)
Chart: Share price over the year
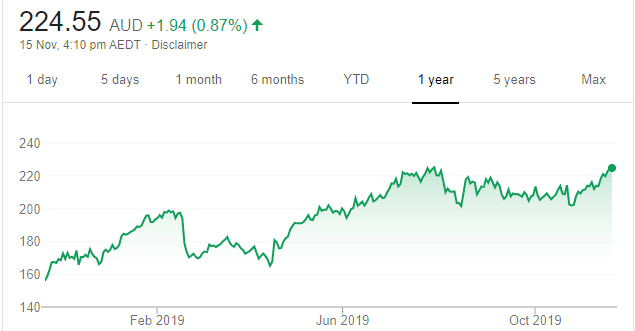
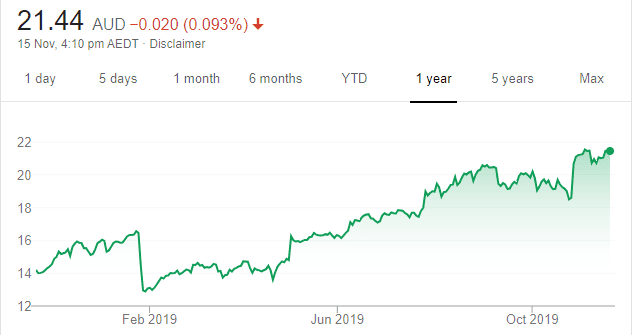
The hearing implants maker has enjoyed strong buying support near $200 a share in the past few months. Given recent price action, we’re more confident the sideways trading range is ending and COH will resume its longer term uptrend. The shares were trading at $221.84 on November 14.
HOLD RECOMMENDATIONS
Woodside Petroleum (WPL)
Chart: Share price over the year
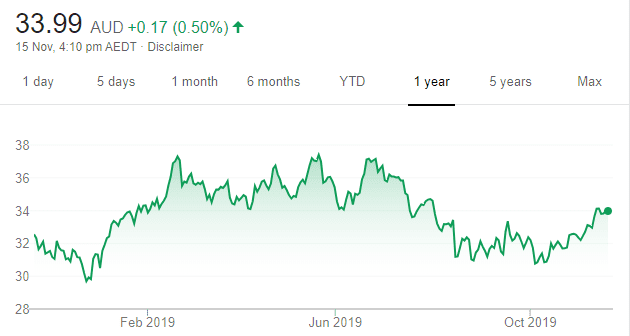
We expect global growth as US and China trade tensions ease and talk of recession dissipates. Consequently, we expect the energy sector to benefit from growth. This oil and gas giant’s share price has risen from $30.85 on October 9 to trade at $33.62 on November 14. We believe the share price will move higher from here.
South32 (S32)
Chart: Share price over the year
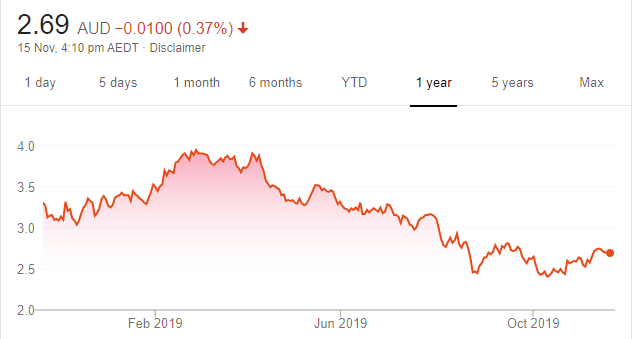
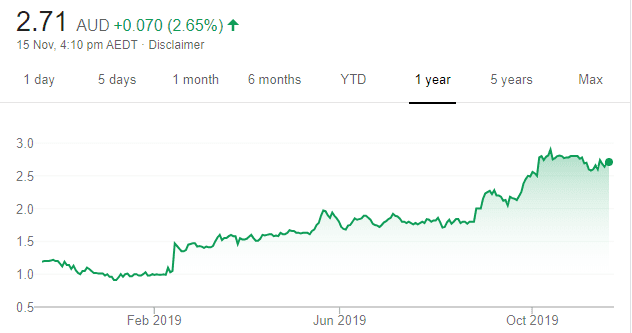
The share price of this metals and minerals company has fallen from a 52 week high of $3.97 on February 28 to trade at $2.66 on November 14. However, we believe commodity stocks should do well as the market feels more positive about global growth. S32 appears to have formed a low on the chart, and we believe the share price is set to recover much of its recent losses.
SELL RECOMMENDATIONS
Flight Centre Travel Group (FLT)
Chart: Share price over the year
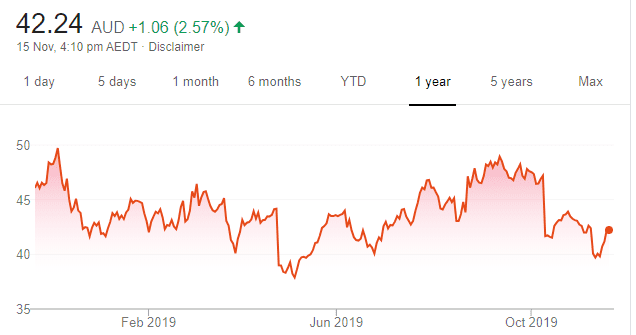
The share price recovery from the May lows came to an abrupt end in October after investors were disappointed with a trading update. Since the update, the shares have continued to look weak. In our view, the shares appear to be trading without strong and consistent buyer support. Based on how FLT is trading on the chart, we believe the share price will remain under pressure.
Northern Star Resources (NST)
Chart: Share price over the year
Top Australian Brokers
- Pepperstone - multi-asset Australian broker - Read our review
- eToro - market-leading social trading platform - Read our review
- IC Markets - experienced and highly regulated - Read our review
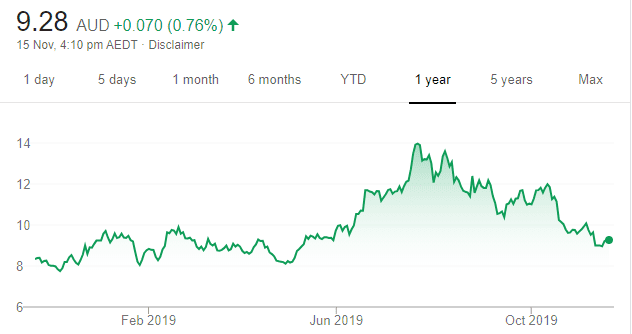
The NST share price has outpaced declines in the gold price. As US sharemarkets continue to make new highs, we believe the gold price will continue to slide. The next support level for NST is $8. The shares were trading at $8.98 on November 14. The shares recorded a 52 week high of $14.055 on July 24.
Peter Moran, Wilsons
BUY RECOMMENDATIONS
Whispir (WSP)
Chart: Share price over the year
Whispir provides a cloud based platform that enables companies to efficiently interact with their customers using a diverse range of messaging systems, including apps, SMS/MMS, email and social media. It has 500 private and public companies as clients across the globe. Most of its revenue is recurring, and we expect it to grow strongly over the coming years. We retain an overweight recommendation.
ResMed (RMD)
Chart: Share price over the year
The medical device maker’s recent results were stronger than expected. It reported an increase in gross margins and market share. A key driver of ResMed’s success is owning the software infrastructure associated with its devices used to treat respiratory disorders. This is particularly appealing to health care providers working outside hospitals. We retain an overweight recommendation.
HOLD RECOMMENDATIONS
City Chic Collective (CCX)
Chart: Share price over the year
This multichannel retailer specialising in women’s apparel recently completed the acquisition of Avenue Stores LLC. This is the second North American e-commerce business the company has bought and it complements its existing range. After a good share price run, the company is fairly valued. Our recommendation is market weight.
Nick Scali (NCK)
Chart: Share price over the year
This furniture retailer has an impressive track record of growth in existing stores and new outlets. However, difficult trading conditions are likely to have a negative impact on half year earnings for the six months to December 31, 2019. We retain a market weight recommendation.
SELL RECOMMENDATIONS
Costa Group Holdings (CGC)
Chart: Share price over the year
This horticultural company has again lowered guidance. Prolonged dry conditions and falling prices continue to present challenges. The company recently raised additional capital. We believe the share price will remain under pressure. We retain an underweight recommendation.
Breville Group (BRG)
Chart: Share price over the year
The share price of this kitchenware company has risen strongly over the past year. However, we believe trading conditions in Europe and Australia are likely to remain difficult, and there’s challenges for the US business as a result of the US and China trade war. The possible impact on sales and margins appear to be underestimated. We retain an underweight recommendation.
Michael McCarthy, CMC Markets
BUY RECOMMENDATIONS
Appen (APX)
Chart: Share price over the year
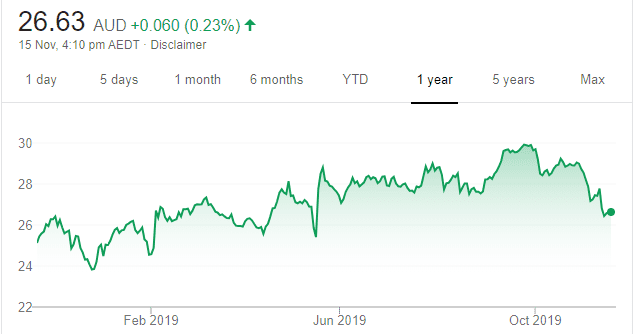
This language technology and data services firm is misunderstood. Its services are highly scalable and desirable in a world continuing to use and embrace more technology. Consensus estimates double the company’s 2018 earnings by 2021. The shares have pulled back from a 52 week high of $32 on July 30 to trade at $23.46 on November 14. We believe the share price retreat has presented a buying opportunity for investors with faith in APX’s future.
Janus Henderson Group PLC (JHG)
Chart: Share price over the year
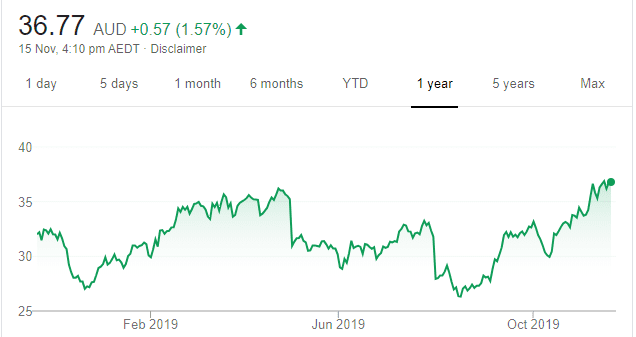
An active and global investor, with $US356 billion under management, according to its latest quarterly report. Outflows have slowed, there’s an ongoing buy-back and its active investment style has clearly improved since June 2019. JHG is higher risk, but it should receive a kicker from a successful Brexit. The break above $36 a share is technically significant. The shares were trading at $36.29 on November 14.
HOLD RECOMMENDATIONS
Commonwealth Bank of Australia (CBA)
Chart: Share price over the year
The quarterly report surprised analysts with a 5 per cent lift in cash profits and expanding margins. No further provision was made for customer remediation following the banking Royal Commission inquiry (after $2.2 billion in previous provisions). This could mean the worst is behind CBA.
Pilbara Minerals (PLS)
Chart: Share price over the year
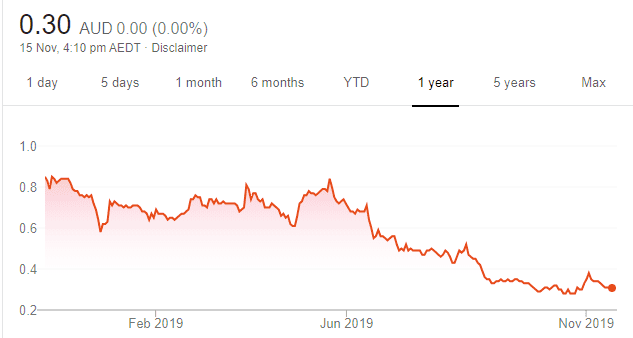
The share price of this emerging lithium and tantalum producer has fallen about 75 per cent since its 2018 high. PLS remains a speculative prospect, but it has the potential to make gains from here if lithium prices improve. The shares were trading at 30 cents on November 14.
SELL RECOMMENDATIONS
Westpac Bank (WBC)
Chart: Share price over the year
The bank’s recent $2 billion institutional share placement took markets by surprise, with another $500 million to be raised from retail shareholders. WBC could suffer stock digestion issues for some time, which may pressure the share price. The second half year result showed rising expenses, declining cash profits and a falling margin.
Xero (XRO)
Chart: Share price over the year
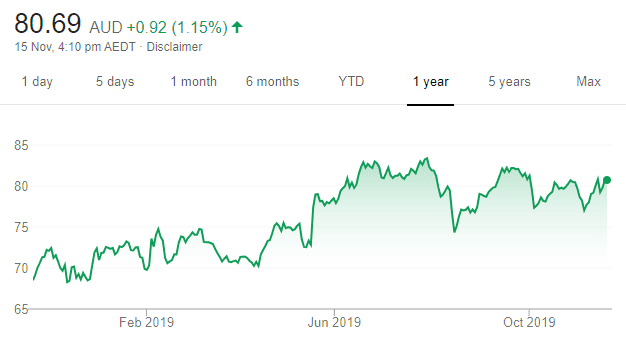
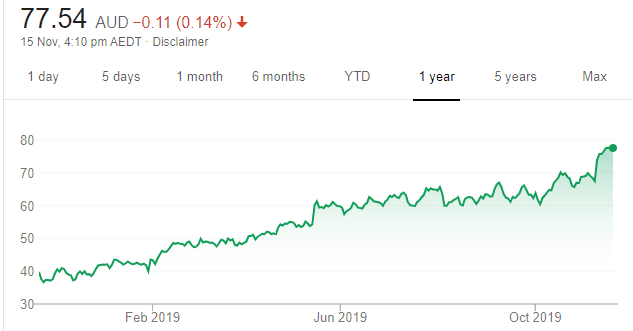
The company is a global leader in cloud accounting and has an exciting future, particularly through its US expansion. However, perhaps the company’s good performance is more than factored into the share price. Recent market action looks like exponential gains, potentially signalling a sharp pull back. The shares have jumped from $67.50 on November 6 to trade at $78.04 on November 14. Investors may want to consider locking in some gains.
The above recommendations are general advice and don’t take into account any individual’s objectives, financial situation or needs. Investors are advised to seek their own professional advice before investing.
Please note that TheBull.com.au simply publishes broker recommendations on this page. The publication of these recommendations does not in any way constitute a recommendation on the part of TheBull.com.au. You should seek professional advice before making any investment decisions.


