
Free Knigthsbridge Trading Academy worth $2750 with Axitrader

Tom Bleakley, BW Equities
BUY RECOMMENDATIONS
OptiComm (OPC)
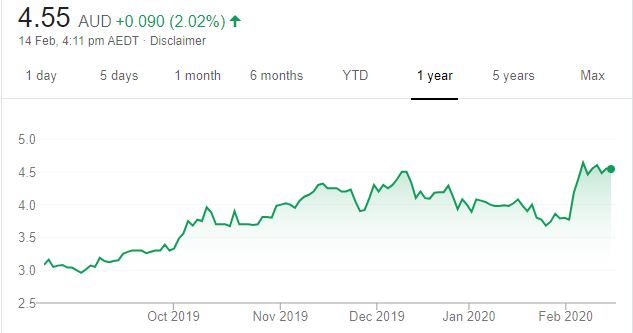
Chart: Share price over the year
A telecommunications carrier that builds and operates fixed line, fibre based networks in new residential developments. OPC generates growing revenue with each new active lot. Margins on network operations remain strong. Net profit after tax was up 18 per cent to $20.22 million in 2019 on a pro forma basis.
5G Networks (5GN)
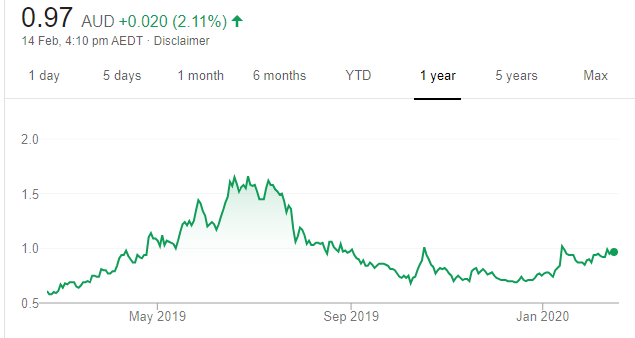
Chart: Share price over the year
This telecommunications carrier operates across Australia. Since its initial public offering in November 2017, 5GN has acquired five private businesses, including several data centres. 5GN is a well managed company that has successfully integrated bolt on acquisitions, while organically growing earnings. We believe the company offers upside value from here. The shares were trading at 97 cents on February 13.
HOLD RECOMMENDATIONS
Piedmont Lithium (PLL)
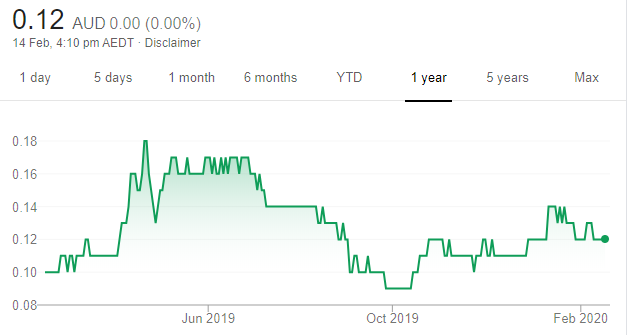
Chart: Share price over the year
Focuses on exploring and developing resource projects. PLL’s flagship lithium hydroxide project is based in North Carolina. In the longer term, electric vehicle producers appear to be favouring lithium hydroxide batteries due to powering vehicles over longer distances. Achieving permit approvals in the US marked a major milestone towards development. The shares were trading at 12.5 cents on February 13.
Ioneer (INR)
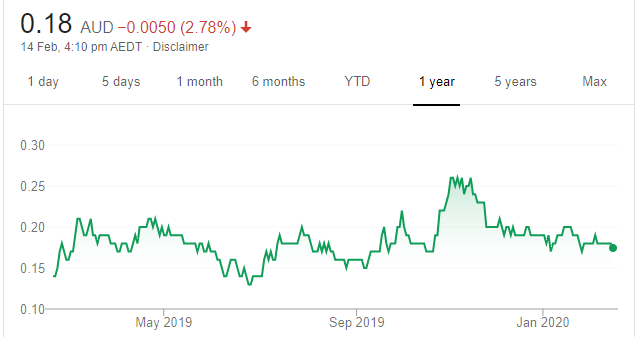
Chart: Share price over the year
INR is a lithium explorer and development company. Its flagship Rhyolite Ridge project is based in Nevada. INR has a capable and experienced management team to move the company towards production. Investing in INR is taking a chance on whether the company can become a producer and take advantage of the impending electric car boom. The shares were trading at 18 cents on February 13.
SELL RECOMMENDATIONS
Myer Holdings (MYR)
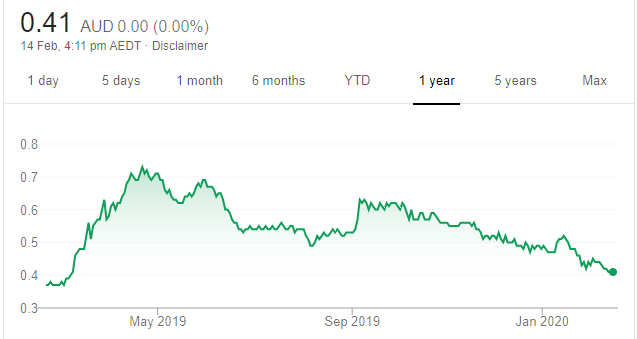
Chart: Share price over the year
The retail giant has announced staff restructuring following its key December sales period, indicating a need for immediate cost cutting. Waning consumer confidence in a subdued economy and a slowdown in Chinese tourism present further challenges. The shares have fallen from 51.5 cents on January 15 to trade at 41.5 cents on February 13.
Qantas Airways (QAN)
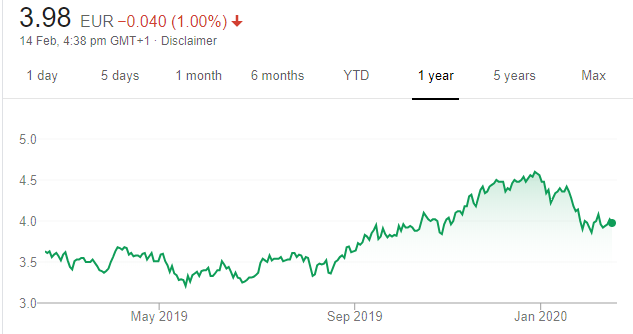
Chart: Share price over the year
Top Australian Brokers
- Pepperstone - multi-asset Australian broker - Read our review
- eToro - market-leading social trading platform - Read our review
- IC Markets - experienced and highly regulated - Read our review
The Coronavirus is likely to test travel confidence for the next six months. Qantas has performed well during the past five years, so now may be an opportune time to take some profits. The shares have fallen from a 12 month high of $7.46 on December 20 last year to trade at $6.47 on February 13.

Peter Day, Sequoia Wealth Management
BUY RECOMMENDATIONS
iShares Global 100 ETF (IOO)
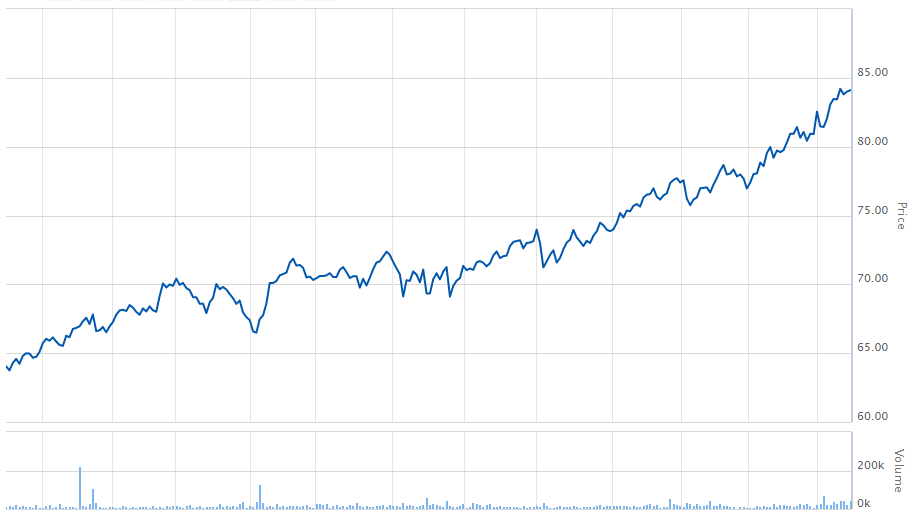
Chart: Share price over the year
To gain international exposure, I like clients to invest in international exchange traded funds. The iShares Global 100 ETF seeks to track the investment results of an index composed of 100 large capitalisation global equities. For example, the top holdings are Apple 9 per cent; Microsoft 8.5 per cent; Amazon 5.5 per cent and Alphabet 3 per cent.
Woodside Petroleum (WPL)
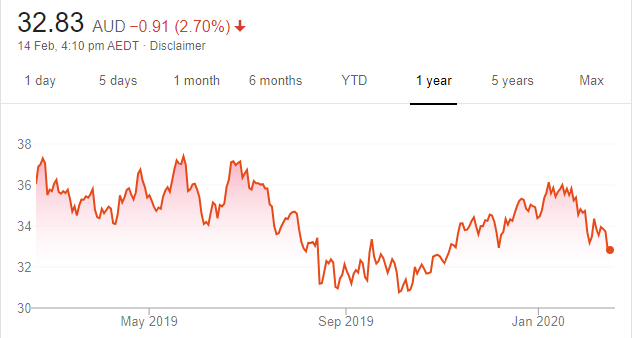
Chart: Share price over the year
Woodside boasts the biggest and most sustainable dividend profile in our oil and gas coverage. WPL’s sustainable fully franked dividend yield was recently above 5 per cent. It also has the strongest balance sheet among its large market capitalisation peers. WPL is in a solid position to support new growth, while retaining yield.
HOLD RECOMMENDATIONS
Telstra Corporation (TLS)
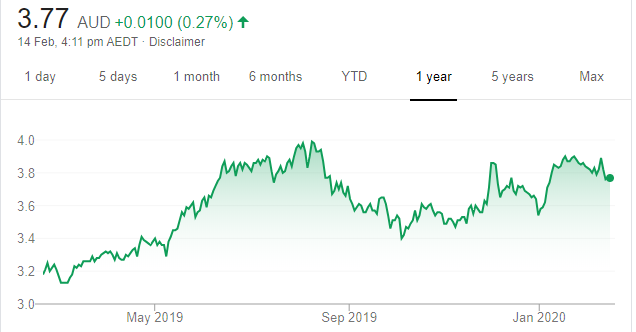
Chart: Share price over the year
The company’s recent half year result was in line with expectations. Total income was down 2.8 per cent on the prior corresponding period to $13.4 billion. Net profit after tax fell 7.6 per cent to $1.14 billion. The company announced a fully franked interim dividend of 8 cents a share, which includes a special dividend of 3 cents. Telstra is progressing its 5G network, which will attract a growing number of customers going forward.
Lovisa Holdings (LOV)
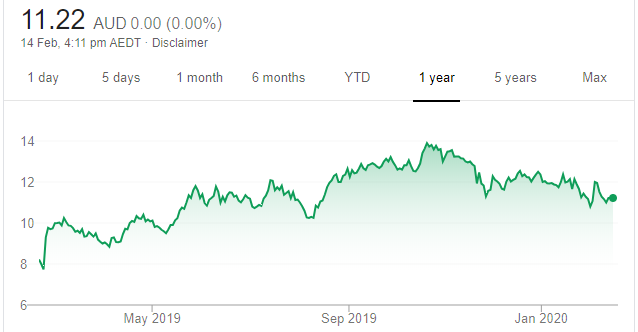
Chart: Share price over the year
LOV is a specialist fast fashion retailer with about 400 stores across 15 countries. Markets in the US, the UK and France present material store growth options for the group. The key driver of future growth is the continuing international store rollout, which the company continues to explore.
SELL RECOMMENDATIONS
Westpac Bank (WBC)
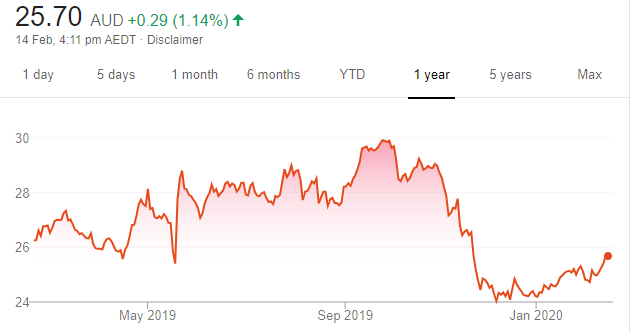
Chart: Share price over the year
Financial intelligence unit AUSTRAC alleges Westpac has contravened the Anti-Money Laundering and Counter-Terrorism Financing Act 2006 on more than 23 million occasions. AUSTRAC has applied to the Federal Court of Australia for civil penalty orders against Westpac. The Australian Prudential Regulation Authority imposed an increase in Westpac’s capital requirements of $500 million to reflect the heightened operational risk profile of the bank.
Coles Group (COL)
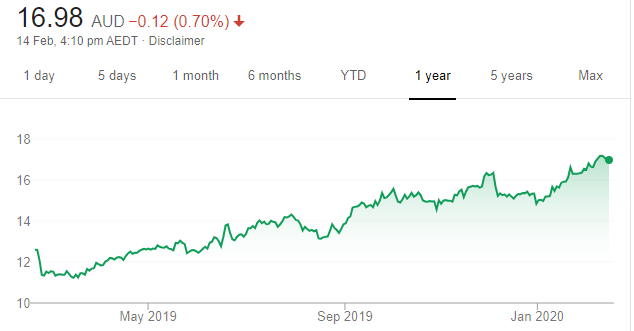
Chart: Share price over the year
Coles is a good business with a strong brand, and is benefiting from a lift in inflation. However, we believe Coles will need to accelerate investment in its store network to meet fierce competition from rival Woolworths. Analyst consensus earnings downgrades are the catalyst behind our recommendation. Woolworths remains our preferred exposure.

Angus Geddes, Fat Prophets
BUY RECOMMENDATIONS
QBE Insurance (QBE)
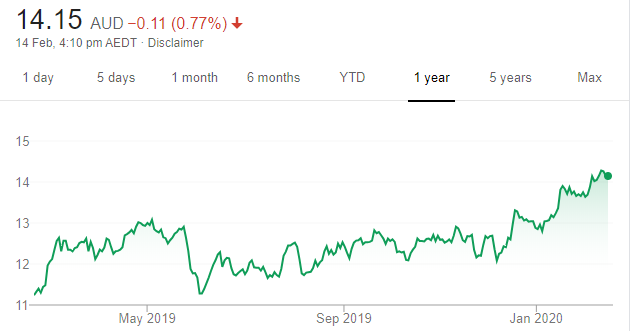
Chart: Share price over the year
Unlike other Australian focused insurers Suncorp and Insurance Australia Group, QBE is yet to release a specific update on claims exposure following the catastrophic bushfires. The company will certainly be impacted. But QBE is more internationally diverse, and also has several tailwinds to justify the investment case. It’s still modestly valued, and is generating positive momentum in premium rates. QBE is embarking on cost reduction initiatives. QBE has simplified its business structure and retains a strong balance sheet.
Western Areas (WSA)
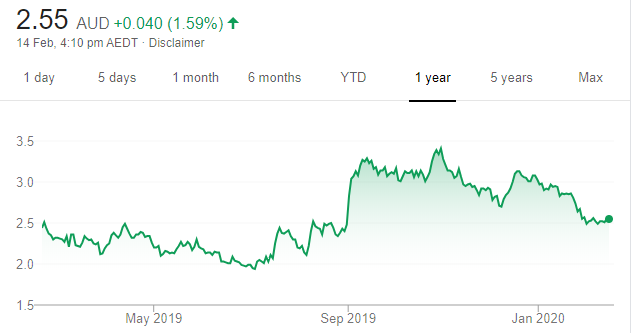
Chart: Share price over the year
This nickel producer is a high quality play on rising demand driven by the electric vehicle market. WSA has already stepped up the pace in 2020, revealing a good second quarter operational result on rising production and lower operating costs. The company also recently secured new supply agreements.
HOLD RECOMMENDATIONS
National Storage REIT (NSR)
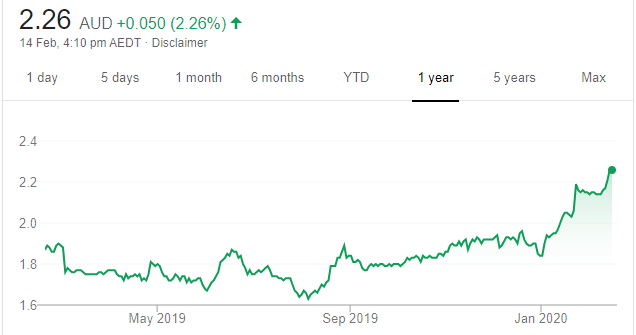
Chart: Share price over the year
During a weaker real estate market, this self storage provider proved to be a resilient operator. The outlook appears even brighter given the property market is recovering. The company’s REIT attributes have already been recognised with a takeover bid in recent weeks. The non-binding indicative proposal for NSR was lodged by Gaw Capital Partners.
Amcor PLC (AMC)
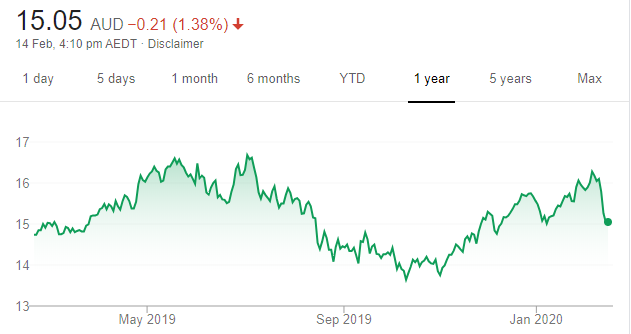
Chart: Share price over the year
Shares in this global packaging giant have edged up in early 2020. After acquiring US competitor Bemis, the company has a broader global footprint, providing significant diversification. Many AMC customers operate in relatively defensive industries as well, so demand should prove resilient. A solid fiscal first quarter update reported in late 2019 was also well received.
SELL RECOMMENDATIONS
BHP Billiton (BHP)
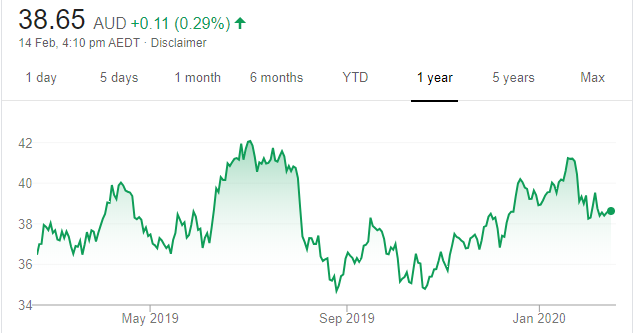
Chart: Share price over the year
In our view, the global miner reported reasonable iron ore and copper production results in the first half. However, in our opinion, the petroleum division underperformed. We believe the iron ore price will struggle to recapture the peaks of last year. We expect global iron ore supplies to increase, as Brazilian miner Vale gears up for more production following a shutdown. We recommend investors lighten exposure.
Rio Tinto (RIO)
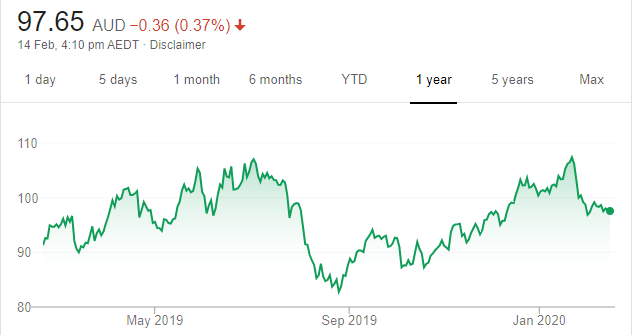
Chart: Share price over the year
It’s a similar story for Rio Tinto, which delivered an ordinary fourth quarter production result, in our view. The company’s key iron ore division was impacted by weather and operational issues in 2019, but still beat guidance. While we remain positive about the outlook for China, a key customer, we believe the tailwind from iron ore prices in 2019 won’t be matched in 2020.
The above recommendations are general advice and don’t take into account any individual’s objectives, financial situation or needs. Investors are advised to seek their own professional advice before investing.
Please note that TheBull.com.au simply publishes broker recommendations on this page. The publication of these recommendations does not in any way constitute a recommendation on the part of TheBull.com.au. You should seek professional advice before making any investment decisions.