Free Knigthsbridge Trading Academy worth $2750 with Axitrader
Chris Conway, Marcus Today
BUY RECOMMENDATIONS
Bravura Solutions (BVS)
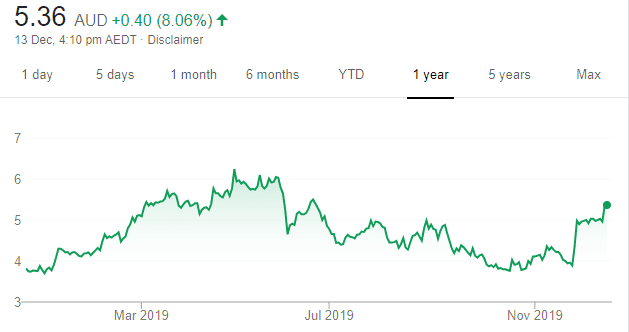
Chart: Share price over the year
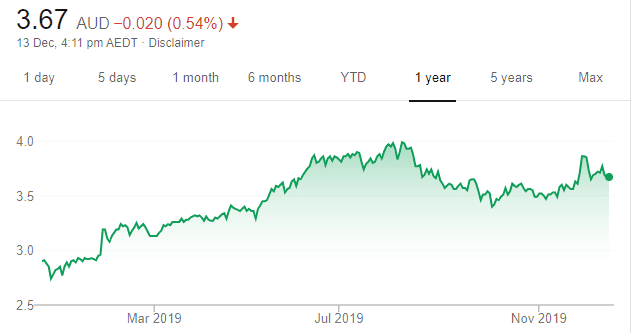
At the recent AGM, BVS informed that fiscal year 2020 was off to a good start and it expects growth across funds administration and wealth management. Customers are sticky and the churn rate is low. Margins are improving despite strong competition. Positive regulatory changes in the UK should provide a tailwind. Additionally, this software solutions provider is relatively cheap compared to its peers, in our view.
Aristocrat Leisure (ALL)
Chart: Share price over the year
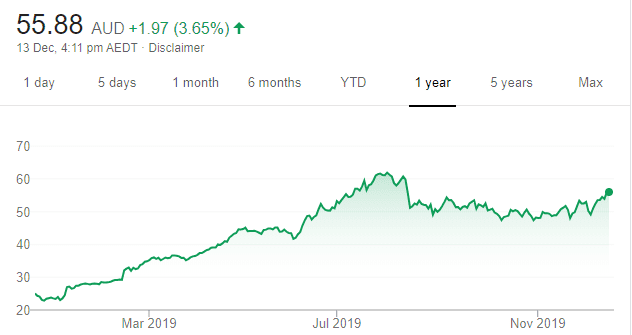
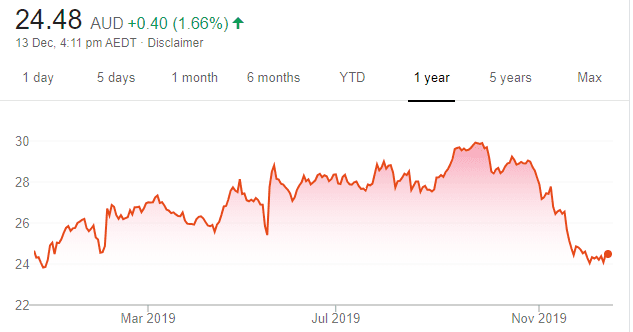
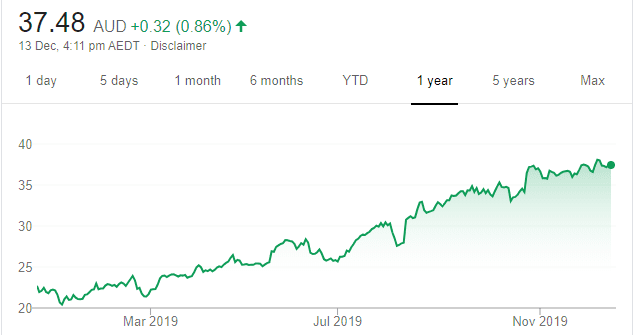
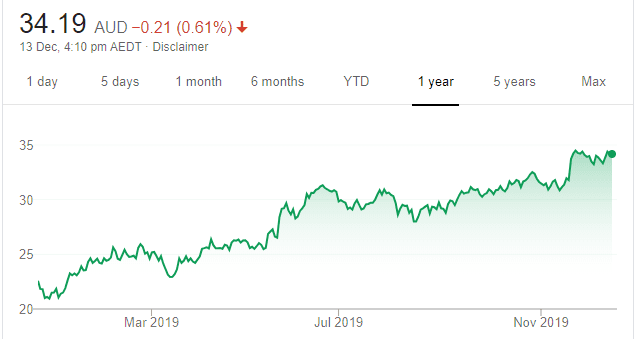
The gaming company’s recent results were exceptional. Net profit after tax and revenue beat expectations in response to significant growth in the US and its digital segments. The outlook is bright and management has a history of delivering growth, whether it’s organic or via acquisition. Despite the share price rising to all time highs, we think it’s relatively cheap given the company’s growth rate. ALL has earnings and price momentum, and we believe it can go higher from here. The shares were trading at $34.59 on December 12.
HOLD RECOMMENDATIONS
Harvey Norman (HVN)
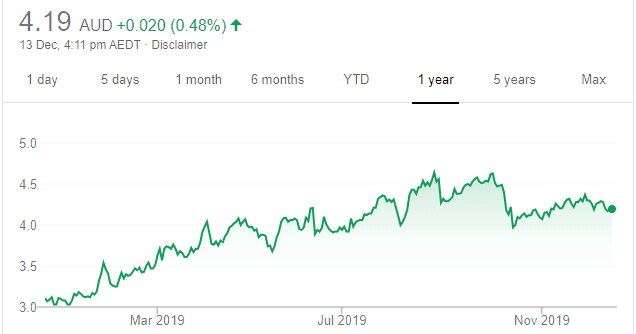
Chart: Share price over the year
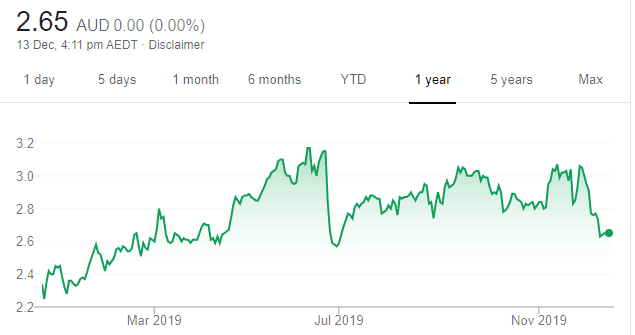
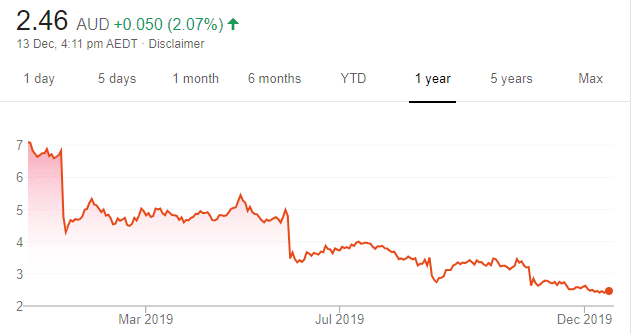
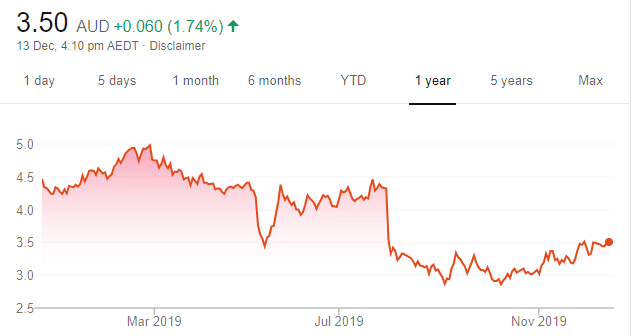
Black Friday sales were up on last year, and the share price has been moving in the right direction. The shares have risen from $2.98 on December 11, 2018 to trade at $4.16 on December 12, 2019. Net profit before tax was $574.56 million for the 12 months to June 30, 2019, up 8.4 per cent on the prior corresponding period.
Transurban (TCL)
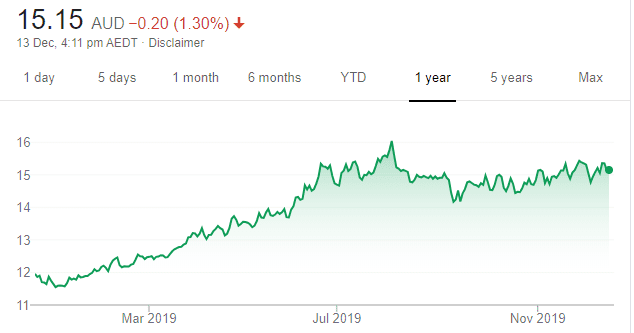
Chart: Share price over the year
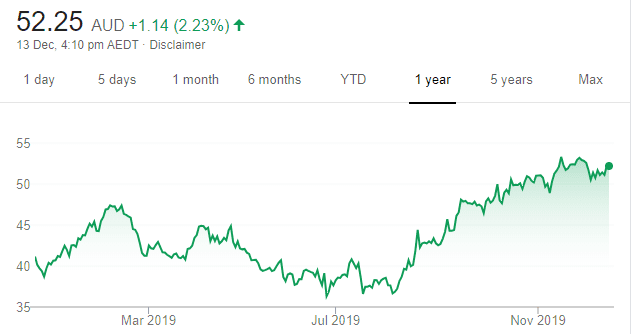
The toll road operator has enjoyed a stellar run in the past 12 months, benefiting from its bond proxy status as investors hunt for yield. Average daily traffic for the September quarter increased by 1.8 per cent, with varying growth in all markets. The stock appears fully priced at current levels. The board reiterated guidance for distributions to total 62 cents in fiscal year 2020.
SELL RECOMMENDATIONS
Ainsworth Game Technology (AGI)
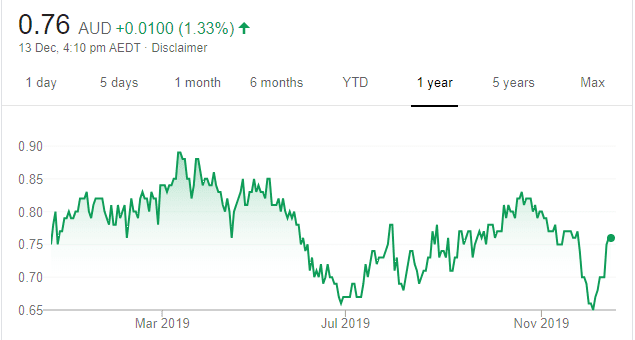
Chart: Share price over the year
The gaming company recently announced a downgrade to fiscal year 2020 earnings, as it expects results to be subdued given a challenging domestic market. For the first half of fiscal year 2020, the company expects a $4 million loss before tax, with a return to profit expected in the second half. The stock recently traded at 52 week lows and we don’t see any reason to buy it now. The shares were trading at 69.5 cents on December 12.
Metcash (MTS)
Chart: Share price over the year
Top Australian Brokers
- Pepperstone - multi-asset Australian broker - Read our review
- eToro - market-leading social trading platform - Read our review
- IC Markets - experienced and highly regulated - Read our review
First half 2020 results were underwhelming. Underlying profit after tax and group underlying earnings before interest and tax declined on the prior corresponding period. It expects total supermarket sales for fiscal year 2020 to be negatively impacted by ceasing to supply Drakes in South Australia. In hardware, trade sales are likely to be impacted for the remainder of 2020 by a slowdown in construction activity.
David Thang, PhillipCapital
BUY RECOMMENDATIONS
Telstra (TLS)
Chart: Share price over the year
Telstra is the dominant player in the Australian telecommunications industry. The company’s infrastructure covers more of Australia than its competitors. In our view, consistent capital spending enables TLS to retain competitive edge over its peers. The company was recently trading on a respectable fully franked forward dividend yield of 4.3 per cent. TLS is attractive on valuation grounds.
Magellan Financial Group (MFG)
Chart: Share price over the year
MFG recently updated the market. Total funds under management at November 29, 2019 were $97.715 billion. MFG continues to generate fund inflows. The global fund manager’s distribution relationships in the much larger offshore markets of the UK and the US give it a stronger growth profile than most domestic peers. MFG enjoys an enviable long term track record in international equities.
HOLD RECOMMENDATIONS
Domino’s Pizza Enterprises (DMP)
Chart: Share price over the year
Sales in this global pizza chain have grown by about 15 per cent annually during the past five years. We expect growth rates to continue at around 10 per cent per annum during the next five years. The forward dividend yield is a respectable 3.2 per cent, which is franked at 86.4 per cent. Combining growth and yield make for a tasty investment recipe.
Macquarie Group (MQG)
Chart: Share price over the year
The financial services giant continues to deliver consistent annual earnings growth. An added bonus is the company’s dividend yield around 4 per cent, which is franked at 45 per cent. The path is clear for further gains over the broader horizon.
SELL RECOMMENDATIONS
Westpac Bank (WBC)
Chart: Share price over the year
The bank has a long battle ahead after financial intelligence unit AUSTRAC alleges Westpac contravened the Anti-Money Laundering and Counter-Terrorism Financing Act 2006 on more than 23 million occasions. The risk of further share price downside during the next 18 months would likely erode the healthy dividend yield on offer. Investor capital is better placed elsewhere.
Costa Group Holdings (CGC)
Chart: Share price over the year
This Australian horticultural company has continued to announce negative trading updates to the market. In our view, agricultural and pricing related issues due to the drought continue to put a lid on future earnings. In the absence of any positive catalyst, the risk remains to the downside.
Jabin Hallihan, Morgans
BUY RECOMMENDATIONS
JB Hi-Fi (JBH)
Chart: Share price over the year
Given the Australian property market is recovering, we expect improving home owner sentiment to lift white good sales during the Christmas trading period. This consumer electronics giant could surprise on the upside at its next result. The shares have performed strongly during 2019. A recent dividend yield of almost 4 per cent is also appealing.
Adelaide Brighton (ABC)
Chart: Share price over the year
The share price of this building products company appears to have found support after a significant fall during 2019. The company’s recent forward fiscal year 2020 price/earnings ratio of 17.5 times is attractive compared to the ASX Industrials price/earnings ratio of 26 times. The stock should benefit from a recent bounce in property prices and any improvement in building approvals.
HOLD RECOMMENDATIONS
Westpac Bank (WBC)
Chart: Share price over the year
The share price has been punished after financial intelligence unit AUSTRAC alleged Westpac contravened the Anti-Money Laundering and Counter-Terrorism Financing Act 2006 on more than 23 million occasions. WBC looks cheap, as the shares were recently trading on a forward fiscal year 2020 price/earnings multiple of 10.4 times and a grossed up dividend yield of 10.2 per cent. We’re forecasting fiscal year 2020 net profit of $8.2 billion.
Aristocrat Leisure (ALL)
Chart: Share price over the year
The gaming company’s most recent profit report revealed excellent top and bottom line growth. Aristocrat is more than a poker machine maker, with its online gaming markets continuing to grow. Group revenue is increasing, with more than 50 per cent generated in the US. Australia is the company’s second largest market.
SELL RECOMMENDATIONS
Macquarie Group (MQG)
Chart: Share price over the year
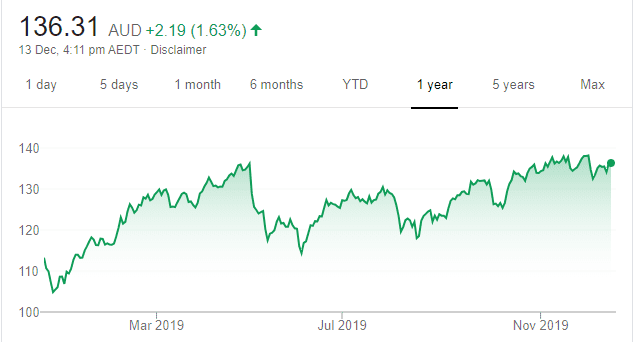
Australia’s largest investment bank has a long history of success, and we’re enthusiastic about the group’s outlook over the long term. The share price has risen from $106.85 on January 2 to trade at $133.64 on December 12. Given the strong performance, investors can consider taking profits.
CSL (CSL)
Chart: Share price over the year
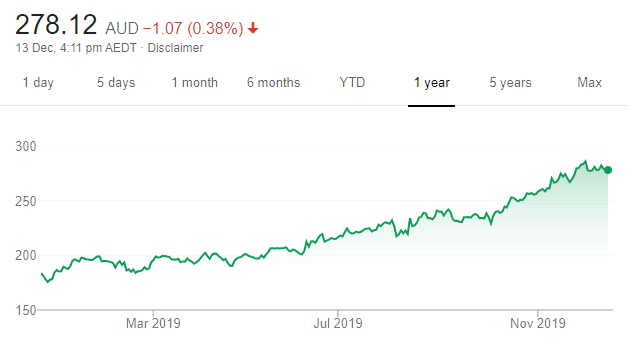
This blood products company is a global leader and a fantastic performer. The plasma industry has significant competitive barriers to entry, placing CSL in an enviable market position. CSL offers excellent international diversification. The shares look expensive, as CSL was recently trading on a lofty price/earnings multiple of 46 times. Don’t sell all, but consider trimming some stock to take profits. The shares were trading at $280.90 on December 12.
The above recommendations are general advice and don’t take into account any individual’s objectives, financial situation or needs. Investors are advised to seek their own professional advice before investing.
Please note that TheBull.com.au simply publishes broker recommendations on this page. The publication of these recommendations does not in any way constitute a recommendation on the part of TheBull.com.au. You should seek professional advice before making any investment decisions.


