Free Knigthsbridge Trading Academy worth $2750 with Axitrader
Chris Conway, Marcus Today
BUY RECOMMENDATIONS
Data#3 Limited (DTL)
Chart: Share price over the year
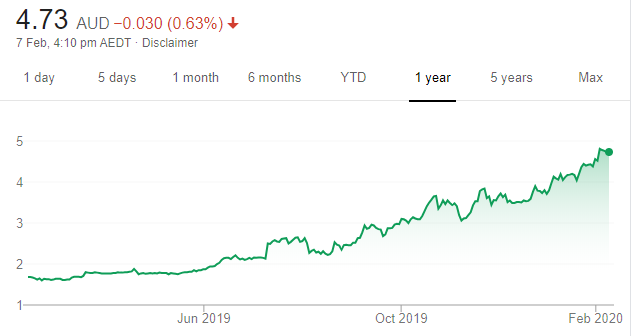
DTL operates in a growing Australian IT market. Management continues to position the business to capitalise on growth opportunities. DTL recently announced a pre-tax profit estimate of $12.5 million for the first half of 2020, up from $9 million on the prior corresponding period. DTL is a robust business with no material debt. It has strong long-term customer relationships and committed partnerships.
Nine Entertainment Co. Holdings (NEC)
Chart: Share price over the year
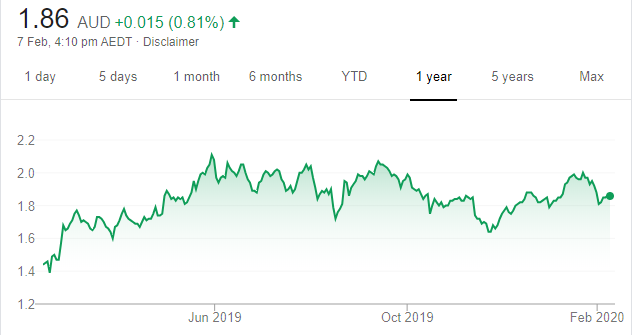
Recent share price weakness in this media giant provides a buying opportunity, in our view. The broadcaster has diversified its revenue base via a merger with print giant Fairfax Media and streaming company Stan. A likely housing market recovery should provide a boost for its multi real estate platform Domain. The shares have fallen from $2 on January 22 to finish at $1.845 on February 6. The catalyst for a higher share price would be a good half year report on February 26.
HOLD RECOMMENDATIONS
Iress (IRE)
Chart: Share price over the year
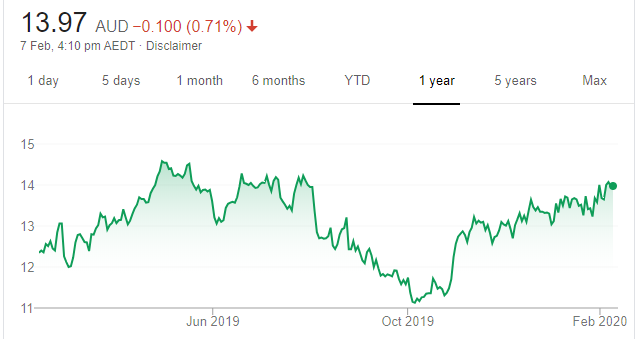
Iress provides software to the financial services industry. It operates in an industry with relatively high barriers to entry. Strong recurring revenue, a well-defined growth platform and an undemanding share price compared to its competitors are all positives. The shares closed at $14.07 on February 6.
Beach Petroleum (BPT)
Chart: Share price over the year
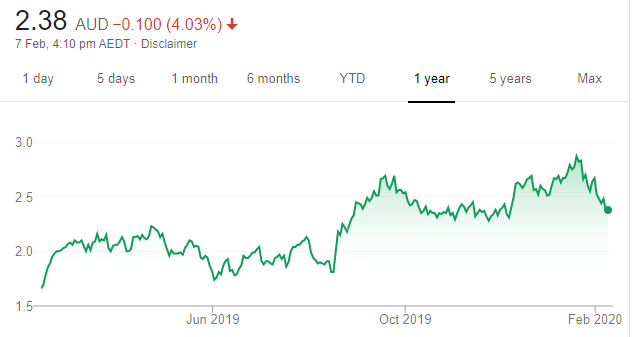
First half production was below our estimates, but this was offset by higher prices and sales revenue. Guidance for fiscal year 2020 was retained. Potential upside over the longer term is yet to be fully priced in. Shares in this oil and gas producer finished at $2.48 on February 6.
SELL RECOMMENDATIONS
Treasury Wine Estates (TWE)
Chart: Share price over the year
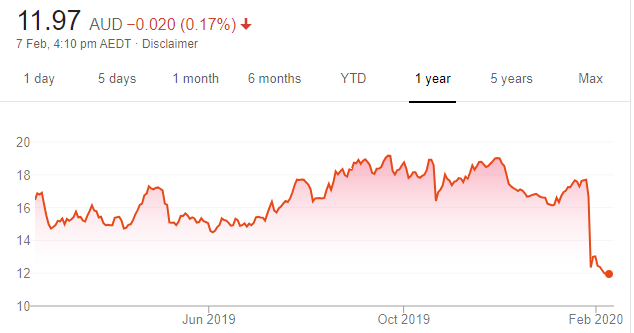
Underperformance in the US led to a recent earnings downgrade. The shares were slashed by 26 per cent in a single session. Challenges persist in the US given surplus wine and discounting issues. The stock price has fallen from $16.68 in late January to close at $11.99 on February 6. Until issues in the US are resolved, we prefer others.
Metcash (MTS)
Chart: Share price over the year
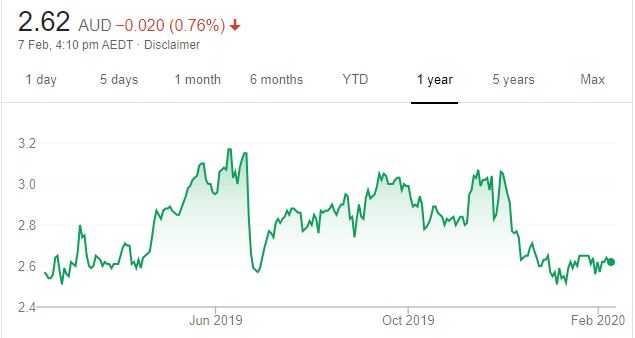
In our view, its supermarkets business lacks the pricing power and location advantages of rivals Coles and Woolworths. The hardware division has been credible during a housing construction cycle at its weakest point in years, but that is simply not enough. The 52 week high was $3.21 on June 12 last year. The shares closed at $2.64 on February 6, 2020.
Top Australian Brokers
- Pepperstone - multi-asset Australian broker - Read our review
- eToro - market-leading social trading platform - Read our review
- IC Markets - experienced and highly regulated - Read our review
Jabin Hallihan, Morgans
BUY RECOMMENDATIONS
Woodside Petroleum (WPL)
Chart: Share price over the year
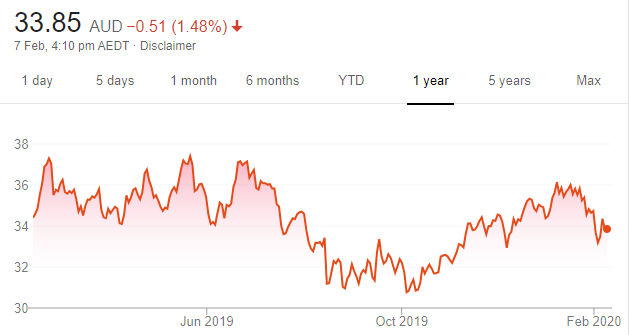
Shares in this oil and gas company look oversold on concerns of potentially weaker crude oil prices. The stock was recently trading on an attractive gross dividend yield of 8.1 per cent. A strong balance sheet supports growth, and we believe the company offers compelling value. WPL reports on February 13. Any capital management initiative would be positive for the share price. The 12-month high was $37.70 on February 20 last year. The shares were trading at $33.86 on February 7.
Corporate Travel Management (CTD)
Chart: Share price over the year
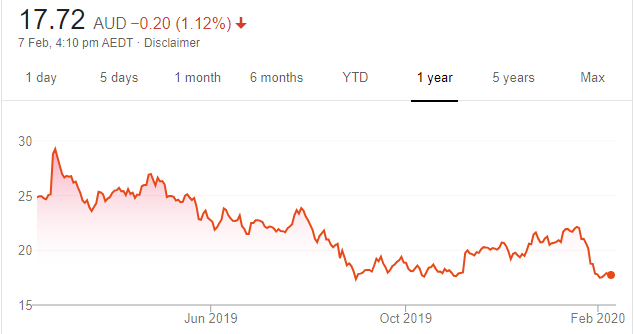
Fears of a global macro economic slowdown and cancelled corporate travel plans due to the Coronavirus have slashed the share price. We believe the time to consider buying high growth businesses, such as CTD, is during market weakness. Our analyst has a $23.40 share price target. The shares were trading at $17.75 on February 7.
HOLD RECOMMENDATIONS
Sydney Airport (SYD)
Chart: Share price over the year
A quality company to hold, but also one that investors can consider buying given recent share price weakness. Bushfires and concerns about the Coronavirus may have recently contributed to a softer share price. The shares have fallen from $9.04 on January 17 to trade at $8.585 on February 7. Management is due to provide an update to investors
APA Group (APA)
Chart: Share price over the year
This gas infrastructure company has a portfolio of defensive assets and growing revenues. APA generates high margins and offers a solid balance sheet. Distributions are increasing. US acquisitions are expected to expand the growth investment platform. Consider buying on any weakness.
SELL RECOMMENDATIONS
Commonwealth Bank (CBA)
Chart: Share price over the year
CBA looks expensive compared to its peers. CBA was recently trading on a forward price-to-earnings multiple of 16 times compared to 11 times for ANZ Bank and 10 times for Westpac. ANZ and Westpac were recently trading on more attractive gross dividend yields.
AMP (AMP)
Chart: Share price over the year
The earnings outlook is flat and the shares now appear fully valued. In our view, this financial services provider needs to repair its brand and re-build management credibility following the fallout from the banking Royal Commission. This will take time. The shares were trading at $1.752 on February 7.
David Thang, PhillipCapital
BUY RECOMMENDATIONS
Avita Medical (AVH)
Chart: Share price over the year
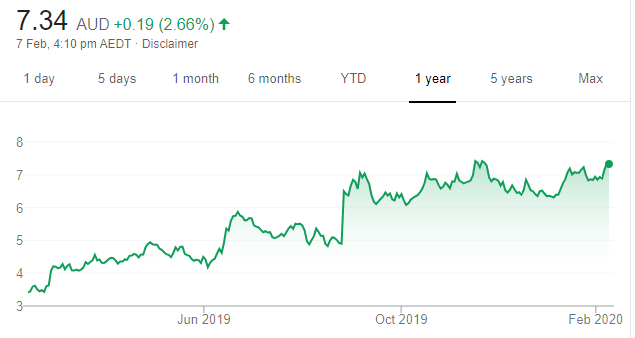
AVH is a medical technology company that develops and distributes regenerative products for treating a range of wounds, scars and skin defects. AVH is operating in the US and is targeting 50 per cent of market share during the next five years. The company is expected to generate higher returns once it ramps up its commercial rollout of products.
Zip Co (Z1P)
Chart: Share price over the year
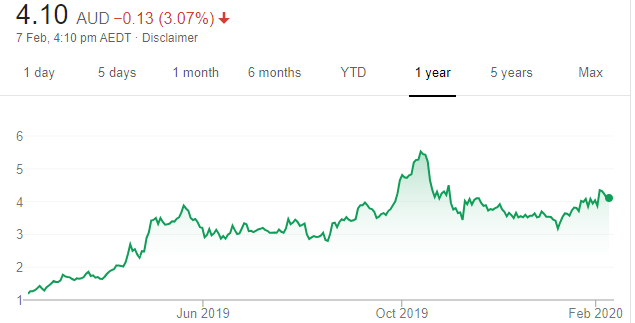
This buy now, pay later company found support at $3.16 in January. From a technical perspective, a bullish engulfing candle has emerged on the chart, suggesting a higher share price in the near term. Should this positive scenario eventuate, the bulls are likely to target a move towards $4.83. Keep a close eye on this stock. The shares were trading at $4.125 on February 7.
HOLD RECOMMENDATIONS
Nanosonics (NAN)
Chart: Share price over the year
A force in the health care industry, NAN focuses on ultrasound probe disinfection. Revenue growth continues each year, and 60 per cent is recurring. From a geographical perspective, 91 per cent of earnings are generated in North America. So any weakness in the Australian dollar is likely to enhance the bottom line.
Macquarie Group (MQG)
Chart: Share price over the year
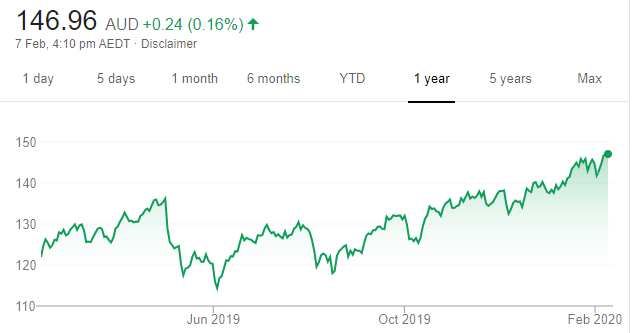
This financial services giant continues to deliver consistent annual earnings growth. An added bonus is the company’s dividend yield of about 4 per cent, which is franked at 45 per cent. MQG is a diverse business, run by a strong management team.
SELL RECOMMENDATIONS
Flight Centre Travel Group (FLT)
Chart: Share price over the year
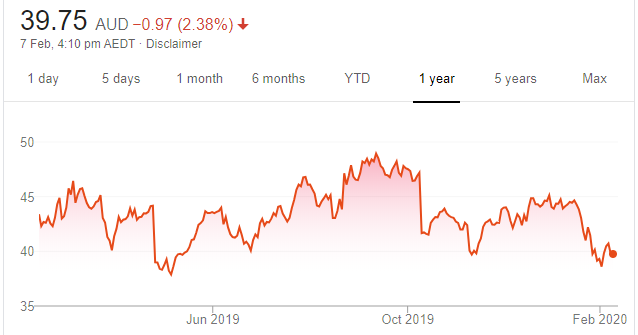
The Coronavirus is negatively impacting the travel sector. Key support is indicated at the May 2019 low of $37.59. In our view, a sustained break below this level is likely to put more downward pressure on the share price. The shares have fallen from $43.90 on January 2 to trade at $40.21 on February 7.
Costa Group Holdings (CGC)
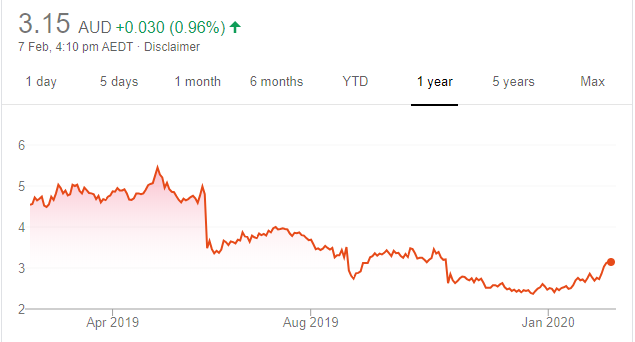
Chart: Share price over the year
In our view, this Australian horticultural company has announced too many negative trading updates in the past 12 months. We believe agricultural and pricing related issues due to the drought continue to put a lid on future earnings. In the absence of any positive catalyst, the risk remains to the downside.
The above recommendations are general advice and don’t take into account any individual’s objectives, financial situation or needs. Investors are advised to seek their own professional advice before investing.
Please note that TheBull.com.au simply publishes broker recommendations on this page. The publication of these recommendations does not in any way constitute a recommendation on the part of TheBull.com.au. You should seek professional advice before making any investment decisions.


