Free Knigthsbridge Trading Academy worth $2750 with Axitrader
Chris Conway, Marcus Today
BUY RECOMMENDATIONS
Cleanaway Waste Management (CWY)
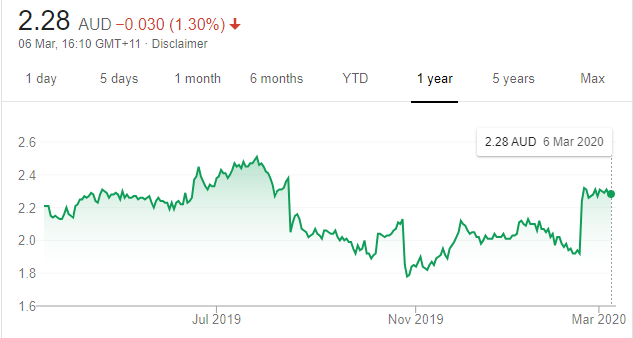
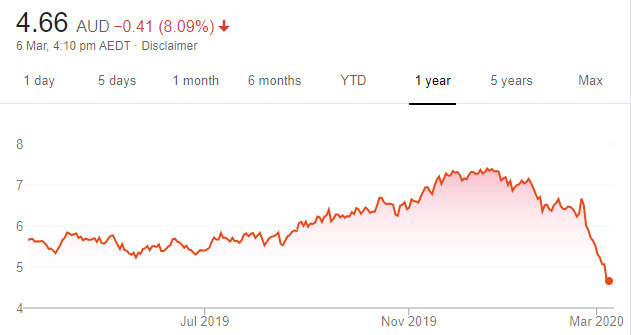
Chart: Share price over the year
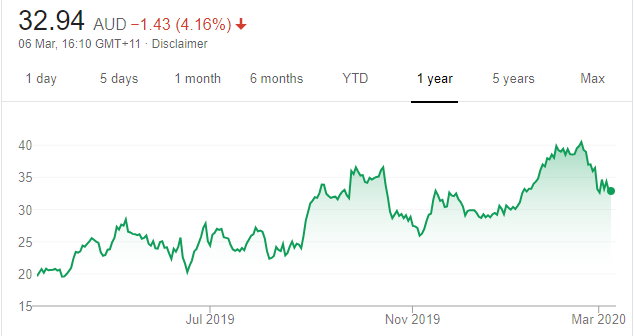
This waste management solutions provider recently reported solid results. Margins expanded in the liquids segment, which is a positive sign on the progress of the Toxfree Solutions integration. CWY’s acquisition of failed Victorian waste management company SKM for $66 million was an astute buy. CWY is implementing a rapid turnaround plan. The assets should be running at full speed by July.
BHP Group (BHP)
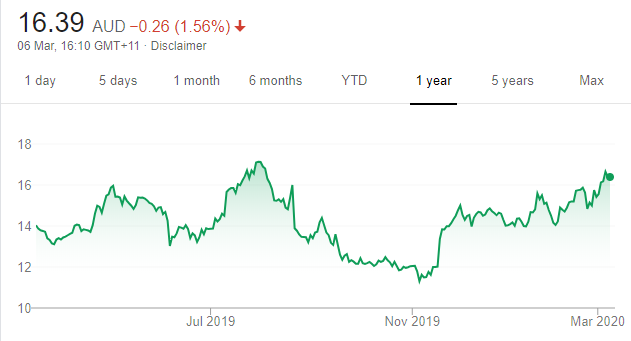
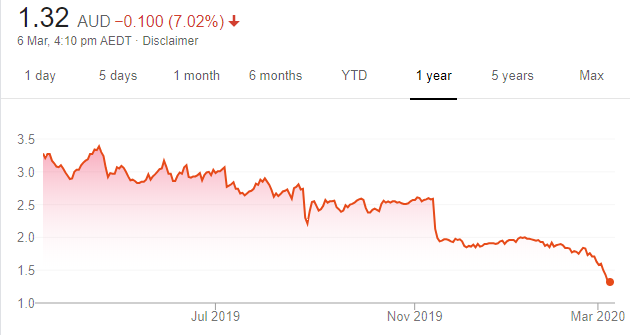
Chart: Share price over the year
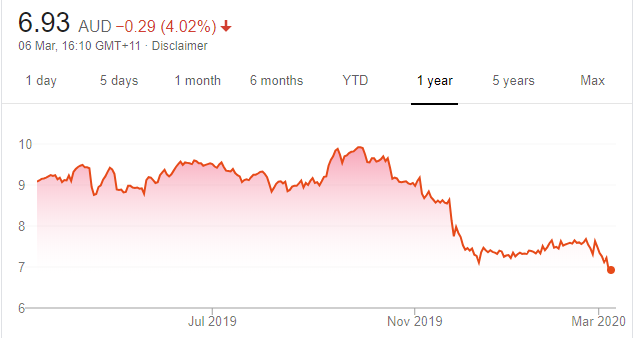
The global miner reported an interim underlying profit of $US5.18 billion, a 39 per cent increase on last year’s prior corresponding period. The recent result was mostly driven by a stubbornly high iron ore price. BHP remains one of the most efficient mining companies in the world. The impact from the Coronavirus and subsequent market sell-off provides a buying opportunity at a reasonable price.
HOLD RECOMMENDATIONS
The A2 Milk Company (A2M)
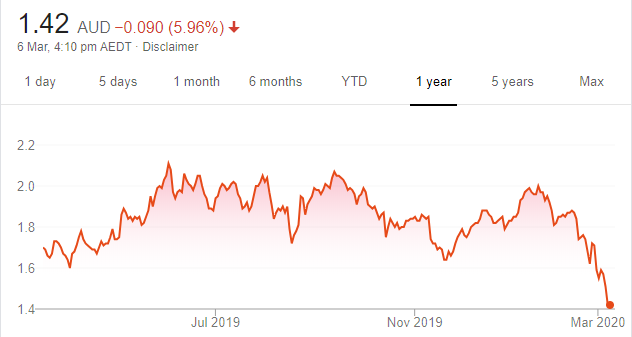
Chart: Share price over the year
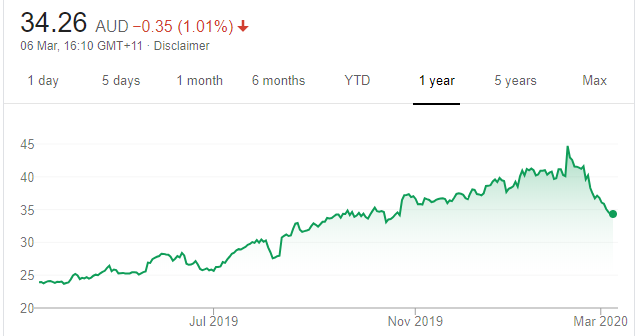
A2M was a standout in the recent reporting season. The company continues to win market share. A2M is taking advantage of its pricing power and effectively managing its channels to market. It reported an increase of 20.5 per cent in interim EBITDA to $263.2 million, driven by gross margin expansion. However, in our view, the stock appears fully valued at this time.
Costa Group Holdings (CGC)
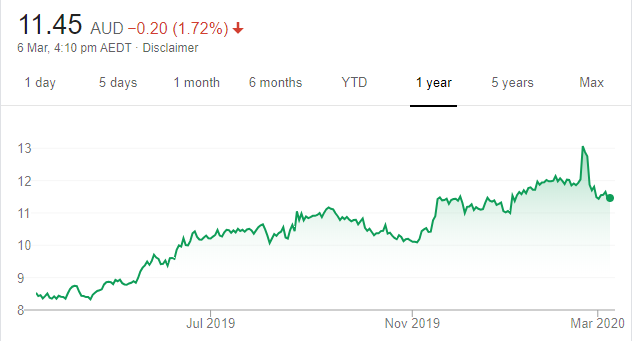
Chart: Share price over the year
Recent results highlighted a tough year for this horticultural business, but the update suggested an improving performance going forward. There’s cause for optimism in parts of the portfolio. Improving prices should enable the mushroom produce division to recover some growth, but citrus remains challenging due to low yields and hail storm damage.
SELL RECOMMENDATIONS
Afterpay (APT)
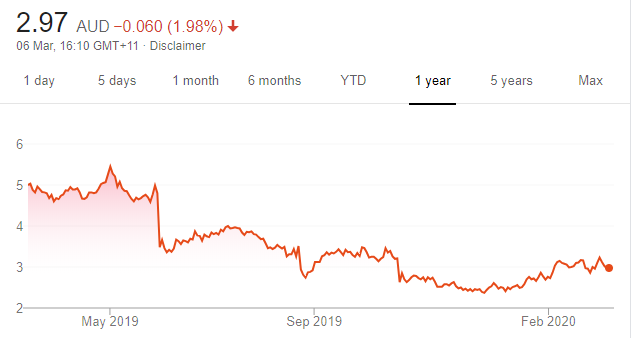
Chart: Share price over the year
We continue to like this buy now, pay later company, but, in our view, the share price climbed too high too fast. Costs are rising, particularly in marketing, as APT continues to expand internationally. It’s hardly surprising that costs are increasing given rapid growth, but it highlights the cost base is more variable than initially anticipated. In our view, significant investment will be required for the company to achieve sustained volume growth.
Bank of Queensland (BOQ)
Chart: Share price over the year
Top Australian Brokers
- Pepperstone - multi-asset Australian broker - Read our review
- eToro - market-leading social trading platform - Read our review
- IC Markets - experienced and highly regulated - Read our review
BOQ recently outlined a fresh five-year strategy. Among the targets is a return on equity of 8 per cent by fiscal year 2022. In our view, this is a considerable challenge that would require flawless execution and above system growth in the home lending business. The bad news is fiscal year 2020 cash profit is expected to be 4 per cent to 6 per cent lower than fiscal year 2019, so there’s more pain to come.
Jabin Hallihan, Morgans
BUY RECOMMENDATIONS
JB Hi-Fi (JBH)
Chart: Share price over the year
Prior to the market pullback, shares in this consumer electronics giant recorded a 52-week high of $46.09 on February 10. The shares closed at $34.61 on March 5. The gross dividend yield was recently 6.1 per cent. The recent fiscal year 2020 price/earnings multiple of about 15 times is attractive. Given another recent interest rate cut on top of a recovering property market, we expect continuing improvement in homeowner sentiment and consumer spending.
Sydney Airport (SYD)
Chart: Share price over the year
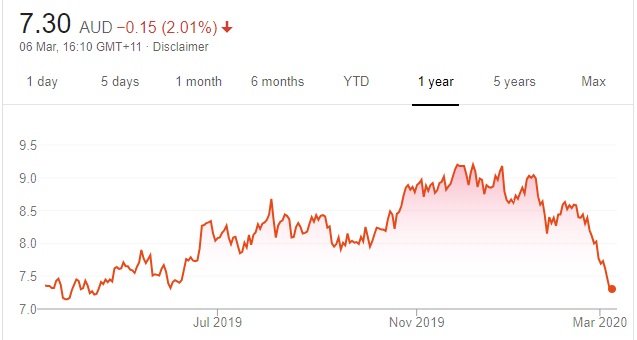
Investors may have over-reacted to the impact of bushfires and the Coronavirus. If you believe this to be the case, compelling buying opportunities have emerged and one, in our view, is Sydney Airport. The shares were priced at $9.03 on January 15. The shares finished at $7.45 on March 5. The company was recently trading on a dividend yield above 5 per cent. Consider buying into periods of weakness.
HOLD RECOMMENDATIONS
Macquarie Group (MQG)
Chart: Share price over the year
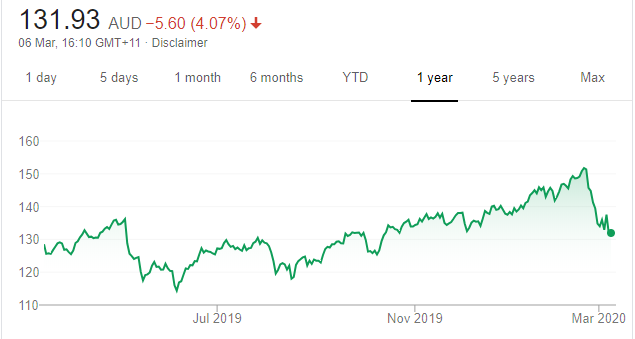
The 52-week high was $152.35 on February 20. The shares closed at $137.53 on March 5. Apart from potential capital growth, a recent dividend yield of almost 5 per cent is attractive. MQG is Australia’s biggest investment bank with a long history of success. Hold for the longer term.
CSL (CSL)
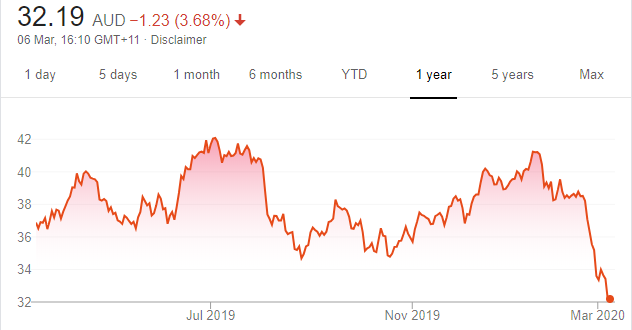
Chart: Share price over the year
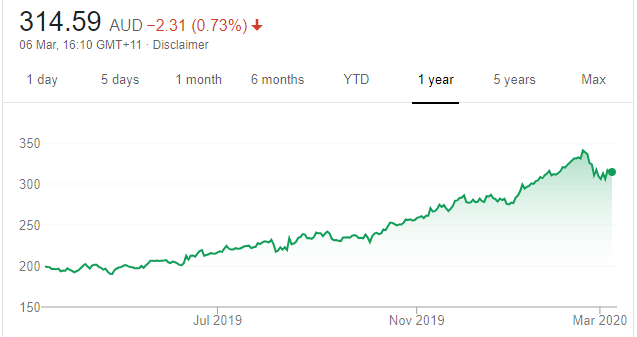
This blood products company is a global leader and a top performer. The stock finished at $316.90 on March 5. In our opinion, the shares look too expensive to buy. That said, the company has an enviable record of success. CSL is well managed, so we retain our hold rating.
SELL RECOMMENDATIONS
Commonwealth Bank of Australia (CBA)
Chart: Share price over the year
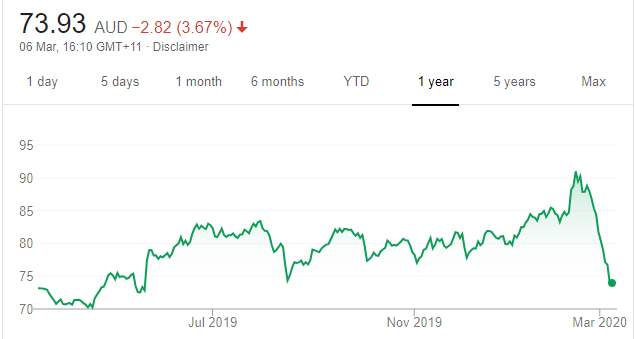
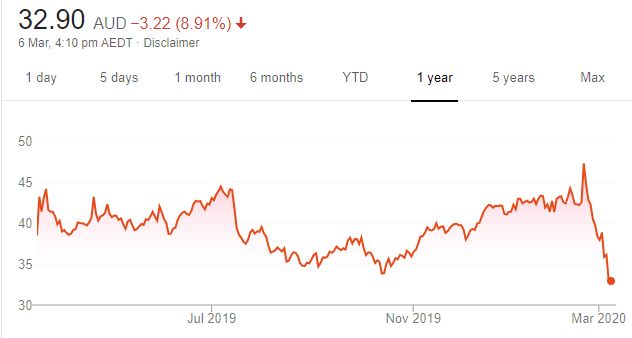
CBA looks expensive compared to peers. The shares closed at $76.75 on March 5. Given the market sell-off, we believe better value can be found in ANZ and Westpac at this point when taking into account forward price/earnings multiples. Consider selling some of CBA and investing in the others.
AMP (AMP)
Chart: Share price over the year
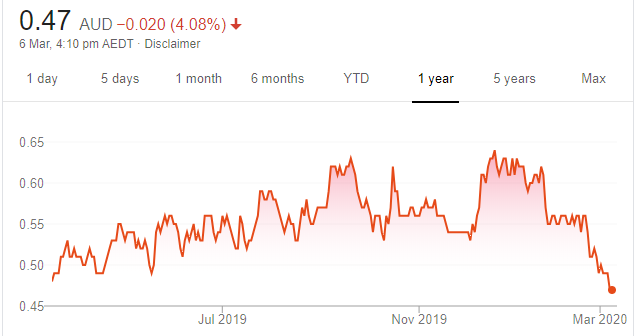
The earnings outlook for this financial services provider is flat, in our view. Although the banking Royal Commission is behind it, the company has suffered reputational damage that may take some time to repair. AMP needs to rebuild its brand and management credibility. The shares finished at $1.645 on March 5.
Nathan Lodge, Lodge Partners
BUY RECOMMENDATIONS
Cooper Energy (COE)
Chart: Share price over the year
This oil and gas company retained production guidance for fiscal year 2020. It also reduced capital expenditure guidance. Investor concerns that lower spot LNG prices may impact south-east Australian gas prices have probably contributed to the share price fall. However, almost 90 per cent of COE’s available planned production is contracted to June 2022. We retain a buy recommendation.
Qantas Airways (QAN)
Chart: Share price over the year
In our view, half year results were positive. The airline has already cut capacity to several countries impacted by the Coronavirus. Management has the ability to mitigate the impact of Coronavirus on second half 2020 earnings and beyond. We retain our buy recommendation given the company’s valuation discount to market and ongoing capital management initiatives. QAN has announced a further buyback of $150 million. Expect short term volatility due to the Coronavirus.
HOLD RECOMMENDATIONS
G8 Education (GEM)
Chart: Share price over the year
The childcare centre operator’s full year results were in line with our expectations given the trading update in November 2019. Fiscal year 2019 underlying net profit after tax of $76.4 million was 3.9 per cent below the prior corresponding period, but ahead of consensus. Total revenue was up 7.2 per cent to $920.1 million, driven by occupancy and fee growth. Occupancy is marginally behind last year due to the bushfires and the Coronavirus.
Nine Entertainment Co. Holdings (NEC)
Chart: Share price over the year
The diversified media giant remains well positioned to deliver higher earnings going forward on the back of attractive growth assets, such as online real estate platform Domain and streaming company Stan. Domain is leveraged to an improving housing market. Television and radio assets will improve in line with advertising markets.
SELL RECOMMENDATIONS
Coca-Cola Amatil (CCL)
Chart: Share price over the year
Fiscal year 2019 results reflected a strong turnaround in performance. Statutory net profit after tax was up 34.2 per cent on the prior corresponding period to $374.4 million. Trading revenue grew by 6.7 per cent to $5.07 billion. However, in our view, CCL was recently trading on a lofty price/earnings multiple of more than 20 times and above our discount cash flow valuation.
Perpetual (PPT)
Chart: Share price over the year
First half 2020 net profit after tax fell 14 per cent on the prior corresponding period to $51.6 million. The fall was driven by net outflows, lower performance fees and investing in strategic growth initiatives. The fully franked interim dividend was cut by 16 per cent to $1.05. Shares in this diversified financial services company are trading beyond our price target.
The above recommendations are general advice and don’t take into account any individual’s objectives, financial situation or needs. Investors are advised to seek their own professional advice before investing.
Please note that TheBull.com.au simply publishes broker recommendations on this page. The publication of these recommendations does not in any way constitute a recommendation on the part of TheBull.com.au. You should seek professional advice before making any investment decisions.


