

Janine Cox, Wealth Within
BUY RECOMMENDATIONS
WiseTech Global (WTC)
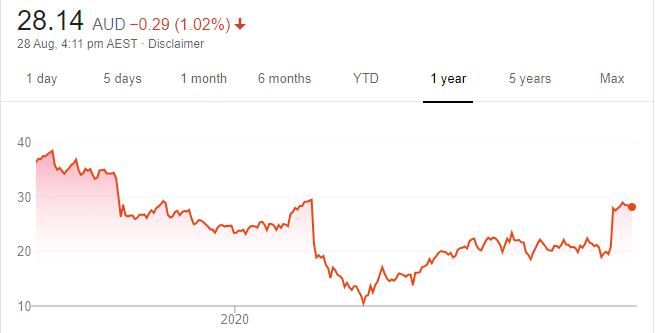
Chart: Share price over the year
WTC sells software to freight forwarders and third party logistics providers. As client businesses grow, so does WTC’s revenue. Total revenue grew by 23 per cent to $429.4 million in fiscal year 2020. The share price soared about 40 per cent on the news when the results were released on August 19. If the share price falls below $27.20, it may be wise for traders to wait and see if there are further dips before using a solid technical entry rule to buy WTC. The shares closed at $28.43 on August 27.
Vita Group (VTG)
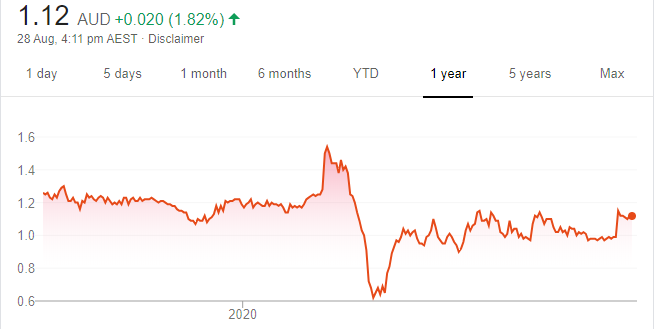
Chart: Share price over the year
VTG operates under brands that include Telstra and Sprout in the consumer discretionary sector. The share price fell from a lofty high of $5.47 in September 2016 to a low of 55.5 cents in March 2020. VTG recently traded to $1.20 in July before slipping back to $1.11. A further rise above $1.15 would indicate a recovery is underway. Traders should be cautious and apply solid rules before buying above this level. The shares closed at $1.10 on August 27.
HOLD RECOMMENDATIONS
Woolworths (WOW)
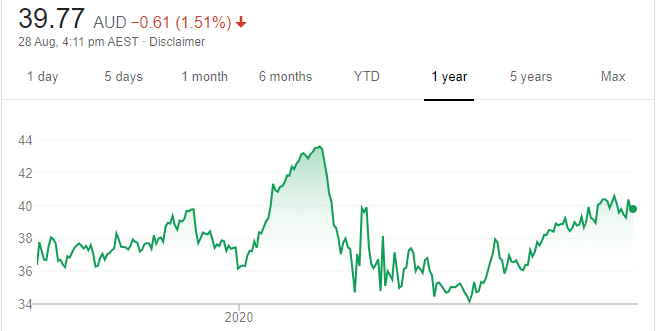
Chart: Share price over the year
Group sales were up 8.1 per cent to $63.6 billion, but net profit from continuing operations fell 21.8 per cent to $1.16 billion for fiscal year 2020. This supermarket giant is acquiring a 65 per cent stake in PFD Food Services for $552 million. In our view, PFD is a long term bet for WOW and a short-to-medium term risk for the share price.
Wesfarmers (WES)
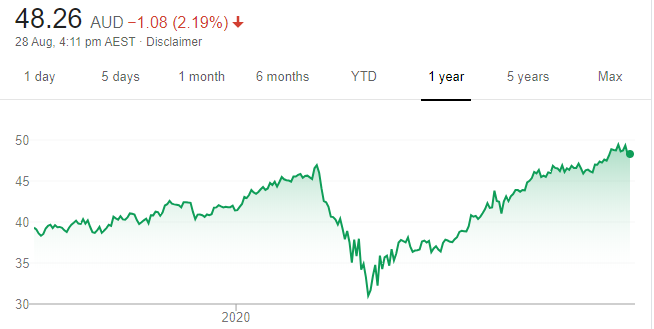
Chart: Share price over the year
The share price of this industrial conglomerate rose to a new all time high of $49.67 on August 27, 2020. In fiscal year 2020, the company reported a net profit after tax of $1.7 billion, which included a write-off of $525 million attributable to the Target business. Continue to hold for further upside while the uptrend remains intact.
SELL RECOMMENDATIONS
ResMed Inc (RMD)
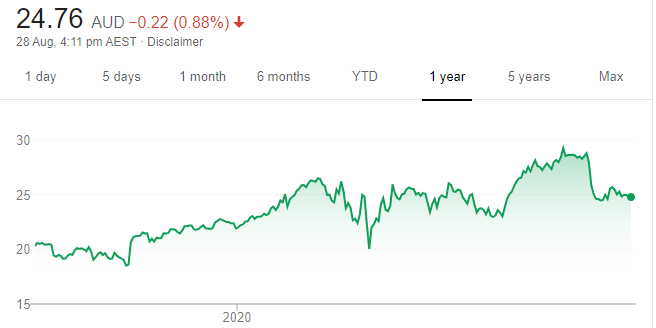
Chart: Share price over the year
The share price of this medical device maker has risen about 700 per cent in the past decade to achieve a high of $29.30 in July 2020. Since the high, RMD has fallen to close at $24.98 on August 27. The risk to shareholder capital increases if the share price falls below $24.18, in our view. If this happens, consider locking in a profit.
Coca-Cola Amatil (CCL)
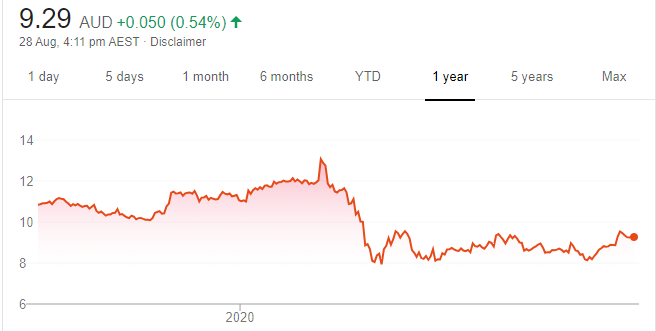
Chart: Share price over the year
A volatile long term price chart demonstrates why CCL is suitable for traders, but not as a buy and then a hold for investors, in our view. The share price must trade back above $11 in the next six to 12 months to reduce the risk of a continuing longer term downtrend below $7.77. Shareholders would be wise to prepare their exit plan. The shares closed at $9.24 on August 27.
Top Australian Brokers
- Pepperstone - multi-asset Australian broker - Read our review
- eToro - market-leading social trading platform - Read our review
- IC Markets - experienced and highly regulated - Read our review

Elio D’Amato, Spotee.com.au
BUY RECOMMENDATIONS
K2fly (K2F)
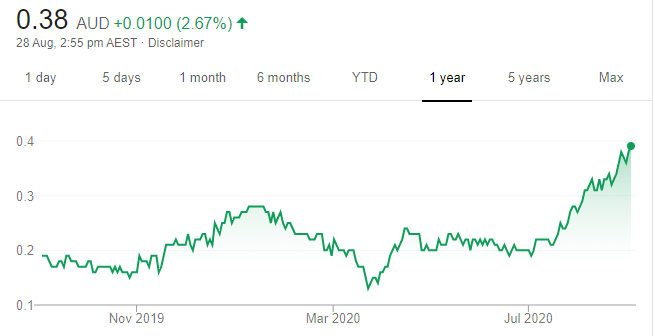
Chart: Share price over the year
K2F provides software solutions and consultancy services to the resources industry. In it’s fourth quarter report, K2F generated positive operating cash flow on the back of increasing customers. Recurring revenue in acquisition RCubed is growing strongly and meeting performance targets ahead of schedule. I own shares in K2F.
Nyrada Inc (NYR)
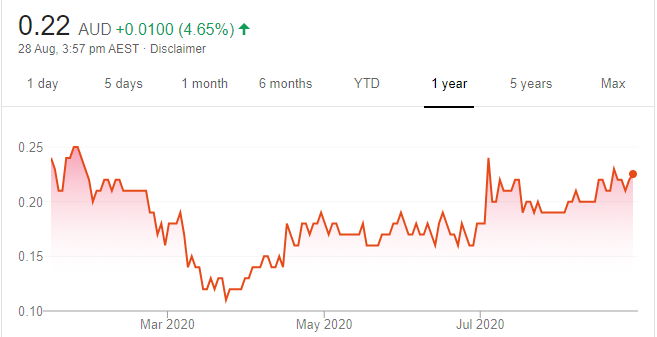
Chart: Share price over the year
This pre-clinical stage drug development company specialises in novel treatments for cardiovascular, neurological and chronic inflammatory diseases. Pre-clinical trials related to lowering cholesterol and brain injuries have so far been encouraging. Pre-clinical stage technologies carry higher risk, but NYR is well managed and capable of minimising risk. The shares finished at 21.5 cents on August 27. I own shares in NYR.
HOLD RECOMMENDATIONS
Integrated Research (IRI)
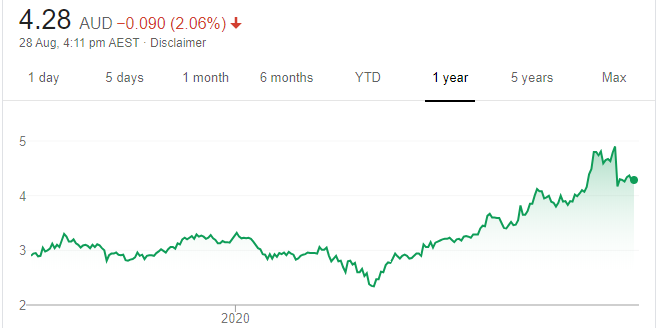
Chart: Share price over the year
Provides performance management solutions for Unified Communications, Payments and IT Infrastructure. The company reported a 10 per cent increase in net profit after tax to $24.054 million for fiscal year 2020. We expect a strong year in fiscal 2021, with continuing growth in Unified Communications and Payments. I own shares in IRI.
PolyNovo (PNV)
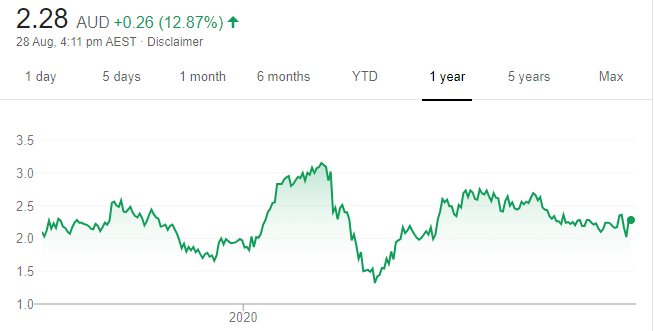
Chart: Share price over the year
Its dermal regeneration polymer NovoSorb treats burns and skin damage. PNV is also testing its technology on other skin conditions. COVID-19 has impeded short term demand for its product. However, PNV is gaining traction in the US, as it seeks Food and Drug Administration approval for treating full thickness burns. This technology is already approved in several other countries. I own shares in PNV.
SELL RECOMMENDATIONS
Telstra (TLS)
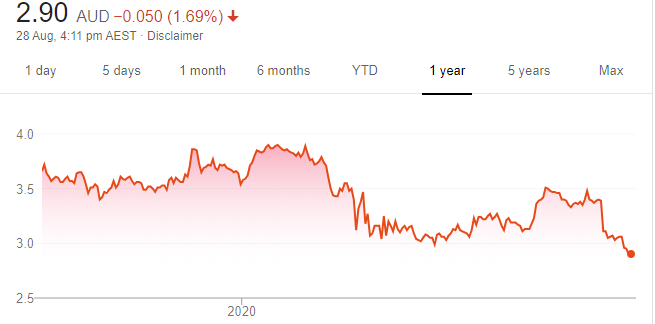
Chart: Share price over the year
Telstra faces stiffer competition on several fronts. TLS is up against a stronger TPG Telecom and Vodafone alliance. Dynamic infrastructure plays Uniti Group (UWL) and Spirit Telecom (ST1) also heighten competition. Believers will point to 5G and a more realistic dividend as a reason to hold. But generating any meaningful capital growth will be challenging, as TLS endeavours to defend its markets.
Goodman Group (GMG)
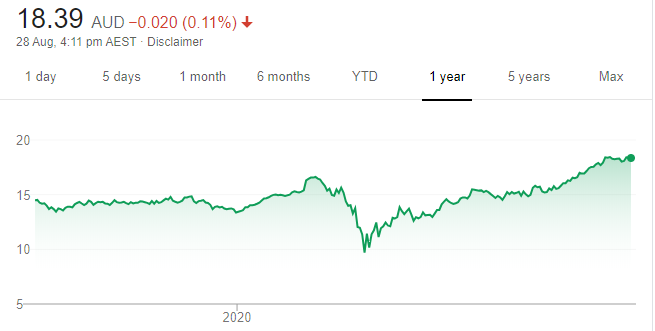
Chart: Share price over the year
Global exposure to industrial and logistics assets resulted in higher revaluations in its latest full year result. Its strong development pipeline has attracted investors. The share price has enjoyed a strong run in the past six months. Given the stock is priced significantly above its peers and trading on a modest forecast dividend yield of 1.6 per cent in fiscal year 2021, we believe it may be prudent to consider taking some profits.

Michael Gable, Fairmont Equities
BUY RECOMMENDATIONS
Qantas Airways (QAN)
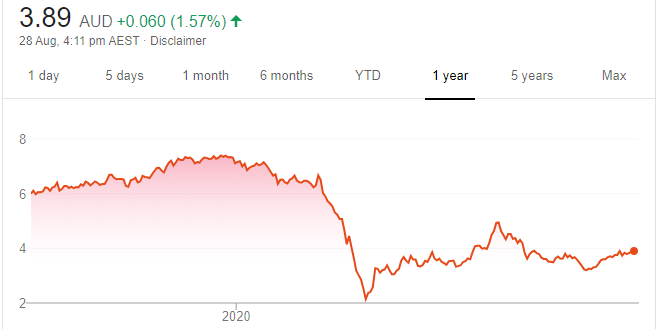
Chart: Share price over the year
Travel stocks are starting to move higher in anticipation that COVID-19 restrictions will gradually ease outside Victoria. Further, any signs of state governments lifting interstate border restrictions will paint a brighter outlook. Our reading of the Qantas price chart shows the stock appears to have bottomed. We expect QAN to gradually recover from these lower levels.
Altium (ALU)
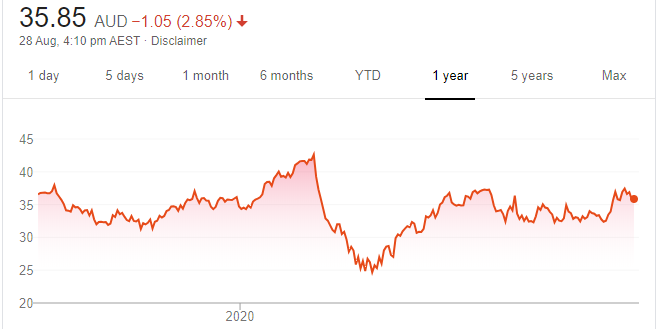
Chart: Share price over the year
This electronic design software company delivered a 10 per cent increase in revenue to $US189 million for fiscal year 2020. It had targeted $US200 million, but was impacted by COVID-19. We expect stronger earnings moving forward. The share price appears well supported on the charts and we see it moving higher from here.
HOLD RECOMMENDATIONS
Xero (XRO)
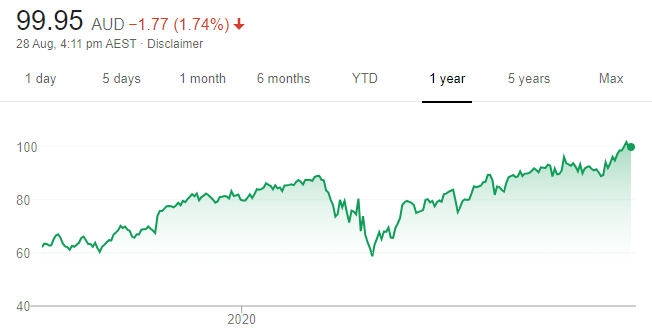
Chart: Share price over the year
In June, the share price of this cloud based accounting software company surpassed the February peak around $90. It then spent several weeks consolidating the move, sitting on top of the February high. That was a bullish sign and we’re now seeing XRO push to a new high again. We’re confident the shares should continue its uptrend. The shares finished at $101.72 on August 27.
Aristocrat Leisure (ALL)
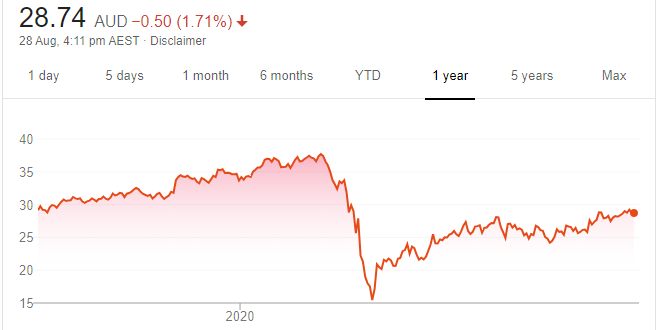
Chart: Share price over the year
This resilient global gaming company is doing well despite COVID-19 restrictions. It’s also leveraged to a recovery as economies start to re-open. At August 27, the share price had almost doubled since its March low, but was still off its 52-week high of $38.23 on February 20. The stock closed at $29.24 on August 27, so there is scope for it to move higher.
SELL RECOMMENDATIONS
Telstra (TLS)
Chart: Share price over the year
The market was disappointed with Telstra’s full year result. The shares have fallen from $3.357 prior to the result on August 13 to finish at $2.95 on August 27. Optimism about Telstra has been waning as the reality of more competition presents challenges. Better investment options exist elsewhere, in my view.
AGL Energy (AGL)
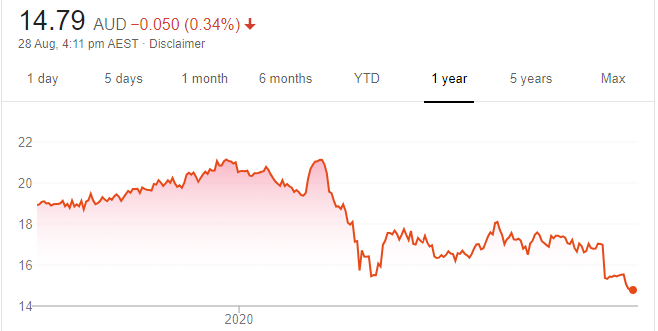
Chart: Share price over the year
Investors punished the share price after the energy giant released its full year results on August 13. We expect underlying earnings to decline in 2021 and margins to be pressured as a result of anticipated lower energy prices. The share price has fallen from $16.99 on August 12 to close at $14.84 on August 27. The share price looks weak on the chart.
The above recommendations are general advice and don’t take into account any individual’s objectives, financial situation or needs. Investors are advised to seek their own professional advice before investing. Please note that TheBull.com.au simply publishes broker recommendations on this page. The publication of these recommendations does not in any way constitute a recommendation on the part of TheBull.com.au. You should seek professional advice before making any investment decisions.