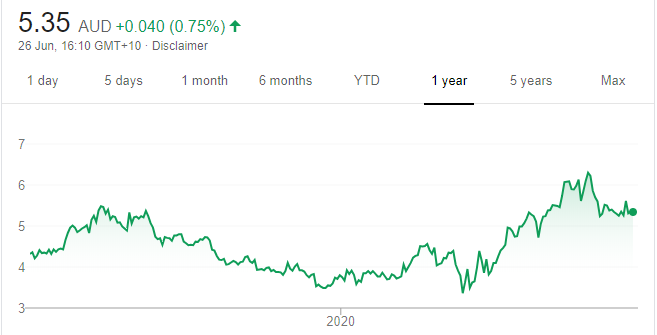
John Athanasiou, Red Leaf Securities
BUY RECOMMENDATIONS
Vortiv (VOR)
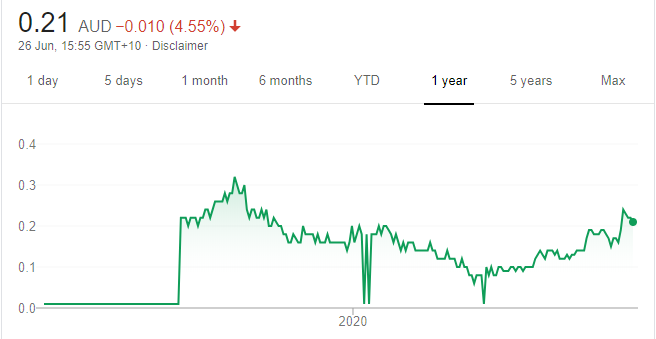
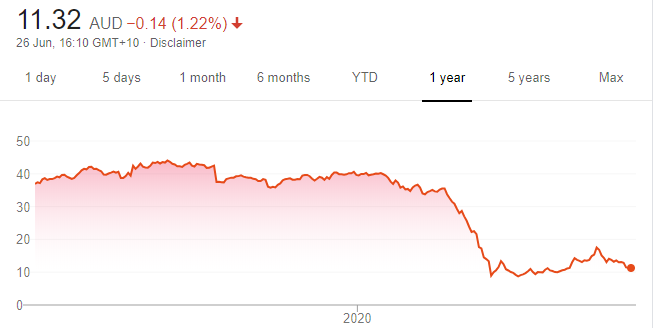
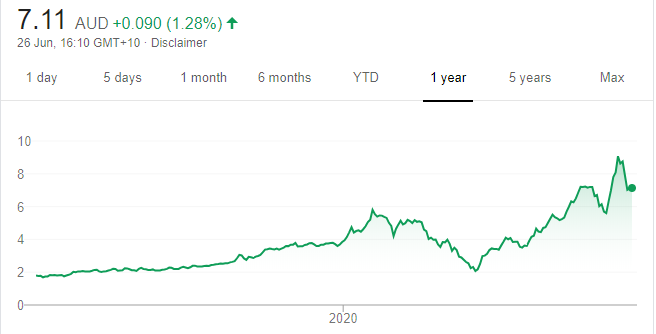
Chart: Share price over the year
Cyber security is a hot industry, particularly after recent cyber attacks on political and private sector organisations in Australia. Vortiv is our preferred stock in the cyber security space. Clients include government departments and financial institutions. VOR’s point of difference is high levels of technical expertise at competitive prices. Recently, the shares have been performing strongly. In our view, VOR is undervalued.
THC Global Group (THC)
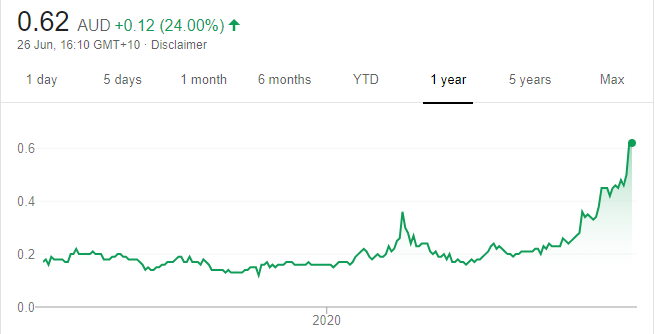
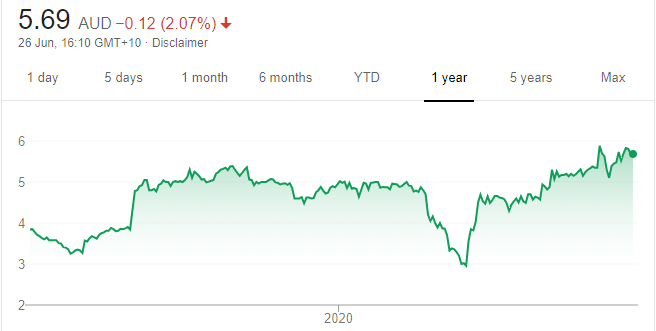
Chart: Share price over the year
This diversified cannabis pharmaceuticals company has established several revenue sources, making it a leader in the medicinal cannabis space. Funds from a recent $6.6 million institutional placement will support working capital and enable THC to accelerate high volumes of medicinal cannabis production. We believe the company offers upside value from here.
HOLD RECOMMENDATIONS
Harvey Norman Holdings (HVN)
Chart: Share price over the year
Unaudited preliminary accounts indicate a 20 per cent profit increase before tax and non controlling interests between July 1, 2019 and May 31, 2020. The retail giant’s share price has been steadily rising since May 23. Hold for a clearer picture when the company reports its full year results on August 28.
Woolworths Group (WOW)
Chart: Share price over the year
The Australian and New Zealand food divisions continue to perform strongly on prior corresponding periods. Panic buying returned to Victoria given a recent increase in Coronavirus infections. WOW’s defensive earnings appeal during challenging times.
SELL RECOMMENDATIONS
Flight Centre Travel Group (FLT)
Chart: Share price over the year
We’re avoiding the travel sector given there’s too much uncertainty. This travel agency stock has been on a roller coaster ride. FLT was priced at $17.52 on June 9. The shares finished at $11.46 on June 25. There’s still the threat of a second wave in Coronavirus infections in Australia.
Crown Resorts (CWN)
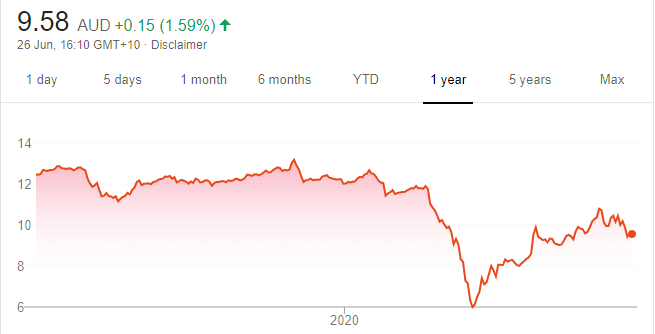
Chart: Share price over the year
The casino operator recorded a 52-week low of $5.84 on March 24. The shares have risen to finish at $9.43 on June 25. We believe investors haven’t taken into account the threat of a second wave of Coronavirus, particularly in Victoria, where infections were recently increasing. We expect revenue to be impacted in the absence of international high rollers.
Top Australian Brokers
- Pepperstone - multi-asset Australian broker - Read our review
- City Index - Aussie shares from $5 - Read our review
- eToro - market-leading social trading platform - Read our review
- IC Markets - experienced and highly regulated - Read our review
Simon Herrmann, wise-owl.com
BUY RECOMMENDATIONS
Vulcan Energy Resources (VUL)
Chart: Share price over the year
Owns a lithium-rich geothermal brine project in Germany. It’s Europe’s largest JORC-compliant lithium resource, and Vulcan’s vision is to produce the world’s first zero carbon lithium hydroxide product by 2023. The company aims to complete a pre-feasibility study later this year. We believe securing off-take and financing agreements in the future are major catalysts as the company fast tracks developing the project.
WhiteHawk (WHK)
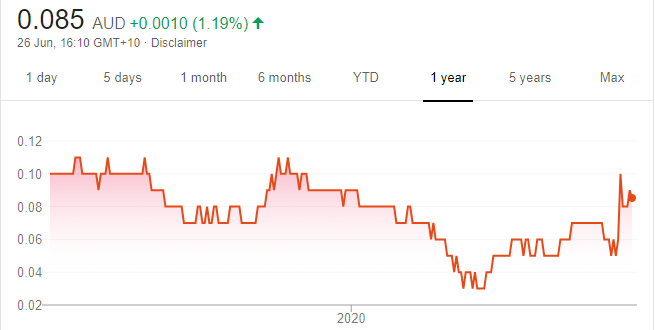
Chart: Share price over the year
WHK is a US based cyber security company, providing a range of products, services and solutions. New and extended contract announcements and partnerships have proven to be share price catalysts. This was demonstrated by recent growth in customer contracts via an expanded product line. As the cyber security market continues to grow, WHK is poised to take advantage of increasing spending supported by a solid sales pipeline in the US across diverse sectors. The shares closed at 8.4 cents on June 25.
HOLD RECOMMENDATIONS
Australian Ethical Investment (AEF)
Chart: Share price over the year
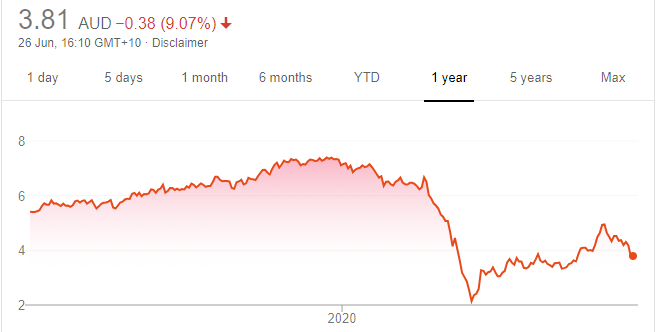
The fund manager has been a star performer since bottoming out during the COVID-19 sell-off. The shares have risen from $2.07 on March 23 to close at $7.02 on June 25. Funds under management total $3.92 billion. While the company’s valuation may be inflated, we believe AEF is well positioned to take advantage of a boom in ethical investing.
MNF Group (MNF)
Chart: Share price over the year
This telecommunications and software provider is financially sound with $38.6 million in cash at December 31, 2019. It recently reaffirmed EBITDA guidance of between $36 million and $39 million for fiscal year 2020. The pandemic is increasing demand for voice and collaboration technology and, in turn, MNF core products.
SELL RECOMMENDATIONS
Clearview Wealth (CVW)
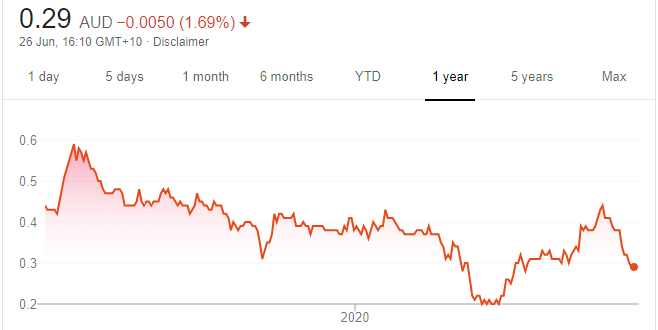
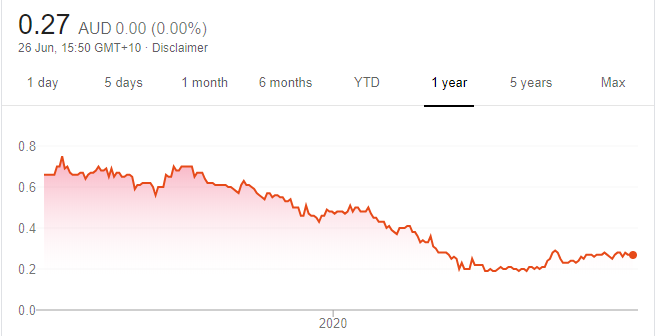
Chart: Share price over the year
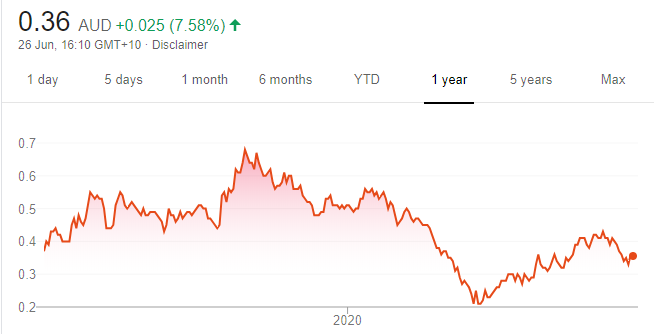
CVW is an Australian financial services company focusing on life insurance and wealth management. Profits declined 15 per cent during the first half and we believe the operating environment continues to be challenging. The share price has fallen from 48 cents on January 3 to close at 27 cents on June 25. We prefer others for better opportunities.
PINCHme.com Inc. (PIN)
Chart: Share price over the year
A New York based company that operates a product sampling and digital promotions platform. The platform matches consumer goods with customer spending habits. Revenue was down 18 per cent in fiscal year 2019 to $11.6 million. The shares have been punished since February to close at 5 cents on June 25. Better opportunities exist elsewhere.
Michael Gable, Fairmont Equities
BUY RECOMMENDATIONS
ResMed Inc (RMD)
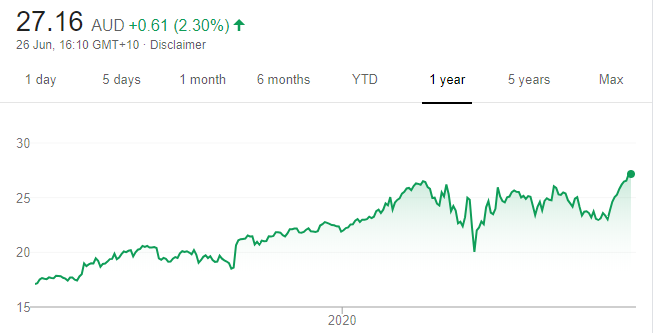
Chart: Share price over the year
This medical device maker is a beneficiary of what appears to be a rotation back into health care stocks. The share price held up well in the past few months, but has lately moved rapidly higher. The shares have risen from $23.03 on June 15 to close at $26.55 on June 25. Momentum has returned to the stock and we expect it to continue trending higher from here.
CSL (CSL)
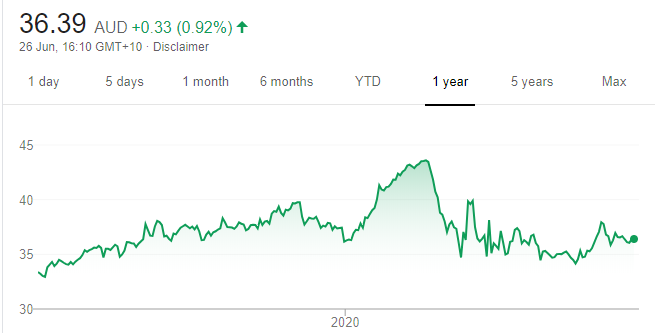
Chart: Share price over the year
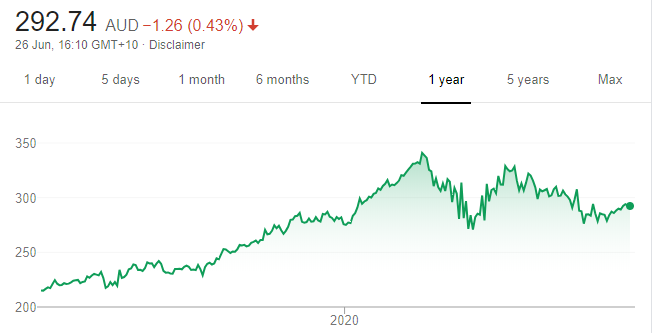
Strong support has returned to the stock since it was priced at $278.50 on June 9. Shares in this blood products company closed at $294 on June 25. We believe recent price action suggests the stock is likely climb from here. The 12-month high was $342.75 on February 20. Even if the broader market weakens, we expect the CSL share price to hold up relatively well.
HOLD RECOMMENDATIONS
Qantas Airways (QAN)
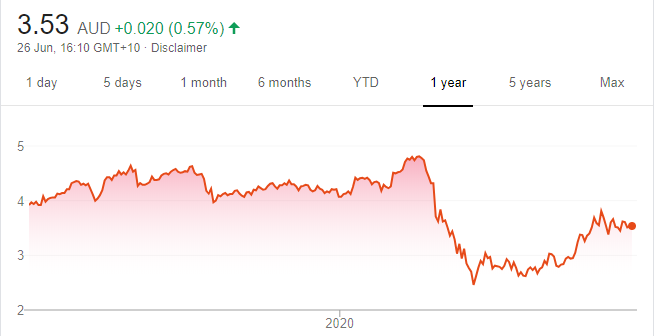
Chart: Share price over the year
The airline went into a trading halt on June 25. Company chief executive Alan Joyce announced an equity raising of up to $1.9 billion and the loss of 6000 jobs. The funds will be used to strengthen the company’s balance sheet and accelerate a recovery. In our view, QAN is effectively a monopoly and downside from here is limited.
Sydney Airport (SYD)
Chart: Share price over the year
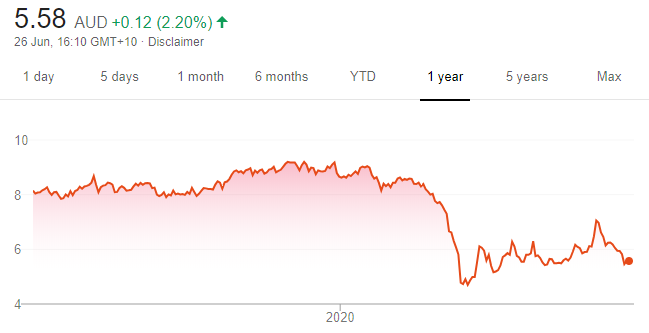
The share price was oversold in March on assumptions that planes would be grounded for much of 2020. As the Australian economy re-opens, flights will gradually increase. Even if flight numbers remain subdued by the end of the year, SYD still looks cheap at a closing price of $5.46 on June 25, in our view. SYD offers good long term upside.
SELL RECOMMENDATIONS
Praemium (PPS)
Chart: Share price over the year
Total funds under administration of $19.4 billion in the 2020 March quarter represented a 5 per cent decline on the previous quarter. PPS, also a provider of wealth management software, faces increasing competition. In our view, the PPS chart looks negative, as the share price recently fell below several major support levels. Recent and increasing volumes to the downside leave us pessimistic.
Evolution Mining (EVN)
Chart: Share price over the year
This gold producer recently downgraded guidance. Gold production at the Mt Carlton operation in fiscal year 2020 is now estimated to be around 60,000 ounces as opposed to earlier guidance of between 70,000 ounces and 75,000 ounces. EVN has also flagged a non-cash impairment of between $75 million and $100 million. We prefer other gold miners at this point.
The above recommendations are general advice and don’t take into account any individual’s objectives, financial situation or needs. Investors are advised to seek their own professional advice before investing.
Please note that TheBull.com.au simply publishes broker recommendations on this page. The publication of these recommendations does not in any way constitute a recommendation on the part of TheBull.com.au. You should seek professional advice before making any investment decisions.


