
Free Knigthsbridge Trading Academy worth $2750 with Axitrader

Michael Gable, Fairmont Equities
BUY RECOMMENDATIONS
Goodman Group (GMG)
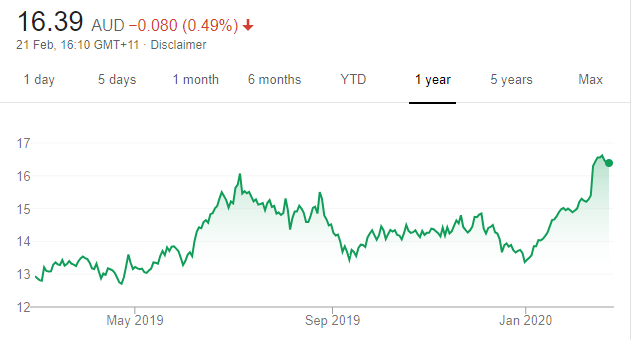
Chart: Share price over the year
This global property group recently reported a solid half year result, upgrading guidance along the way. From a charting perspective, GMG recently moved to a new high. This is a sign of strength and indicates GMG is likely to continue trending higher from here. The shares were trading at $16.495 on February 20.
Commonwealth Bank of Australia (CBA)
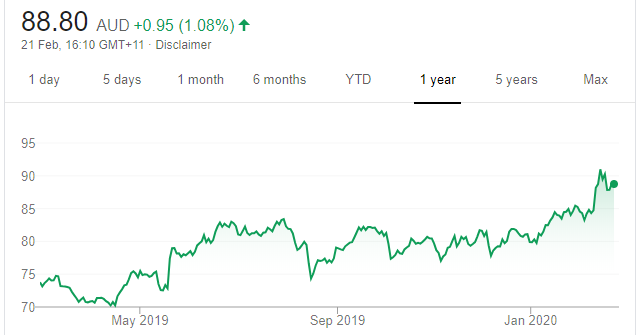
Chart: Share price over the year
The CBA share price had spent the back half of last year unable to make any meaningful headway. It then broke through major resistance in January, and the share price continued to rally on the back of solid half year results. With momentum returning to the share price, I expect it to continue rallying higher from here. The shares were trading at $87.94 on February 20.
HOLD RECOMMENDATIONS
Alumina (AWC)
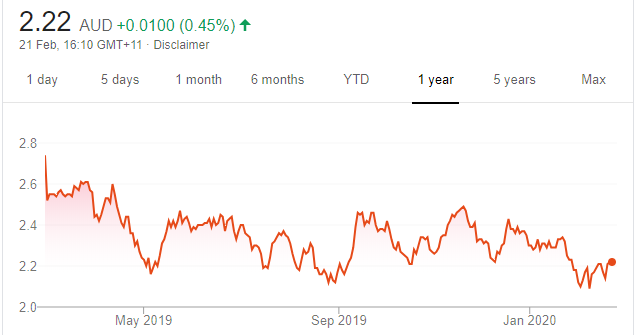
Chart: Share price over the year
AWC appears to have formed a double bottom on the share price chart and good buying support is returning to this company with a 40 per cent stake in Alcoa World Alumina and Chemicals (AWAC). We expect AWC to move higher from here on an attractive dividend yield and forecasts of higher aluminium prices.
Evolution Mining (EVN)
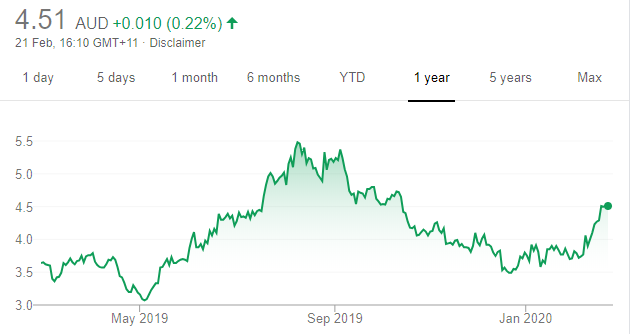
Chart: Share price over the year
Shares in this gold producer are trading well. By pushing through several major technical levels, more volume is returning to EVN shares and momentum is positive. The shares have risen from $3.67 on January 3 to trade at $4.485 on February 20.
SELL RECOMMENDATIONS
Bendigo and Adelaide Bank (BEN)
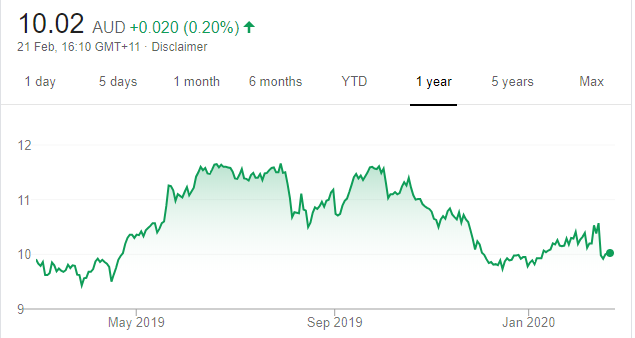
Chart: Share price over the year
There’s a stark difference in performance between the four major banks and their regional counterparts. With BEN recently heading lower and raising more funds, we can’t see much upside – at least in the short term. Better opportunities exist elsewhere in the market, in our view. Consider selling BEN and switching to others. The 12 month high was $11.74 on June 20 last year. The shares were trading at $9.995 on February 20 this year.
Telstra (TLS)
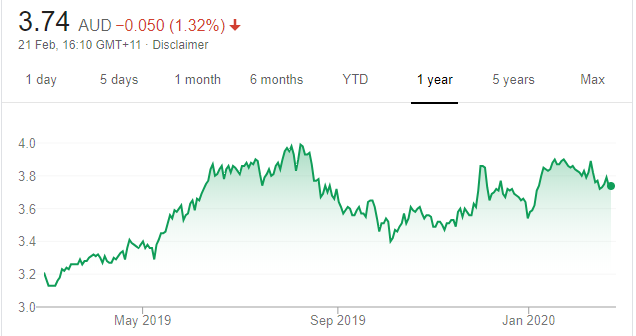
Chart: Share price over the year
Top Australian Brokers
- Pepperstone - multi-asset Australian broker - Read our review
- eToro - market-leading social trading platform - Read our review
- IC Markets - experienced and highly regulated - Read our review
Shares in this national communications giant have enjoyed a good run in the past year, but appear to be topping out on the chart. With the proposed TPG Telecom and Vodafone Hutchison Australia merger now approved, we expect increasing competitive pressures to weigh on Telstra’s performance. The share price has retreated from a 12-month high of $3.978 on August 9 last year to trade at $3.79 on February 20 this year.

Janine Cox, Wealth Within
BUY RECOMMENDATIONS
Telstra (TLS)
Chart: Share price over the year
The positive is a stock price trading well above a major turning point and a significant low of $2.60 in 2018. Provided the share price remains above $3.55, it’s likely to continue the medium term uptrend. The technical analysis indicates that the next good buying opportunity exists if the share price rises strongly above resistance at about $3.90. The shares were trading at $3.79 on February 20.
BHP Group (BHP)
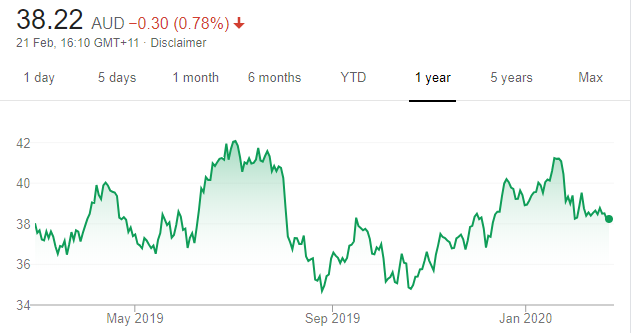
Chart: Share price over the year
Recently, the global miner was trading about 17.5 per cent below its all time high price of $45.30 in May 2008. The Coronavirus created an opportunity to buy into mining stocks, such as BHP and Rio Tinto. BHP must trade back above resistance of between $41 and $42 before the next rise can be confirmed towards a new all-time high. The shares were trading at $38.64 on February 20.
HOLD RECOMMENDATIONS
Baby Bunting Group (BBN)
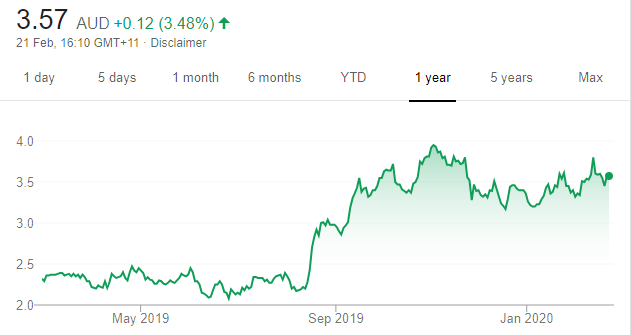
Chart: Share price over the year
The market appeared to support the department store and online retailer after re-affirming full year profit guidance of between $20 million and $22 million. Consequently, we believe the stock price is more likely to trade higher from here. However, if the price fell to around $3.30 in coming months, this would increase the risk of a further decline to between $2.50 and $2.70. The shares were trading at $3.51 on February 20.
OZ Minerals (OZL)
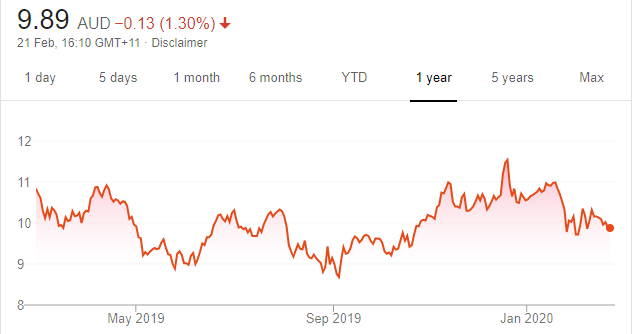
Chart: Share price over the year
The copper producer’s share price has been most volatile during the past two years. Following the high of around $10.70 in June 2018, the share price fell by more than 20 per cent before recovering to a fresh high of $11.04 in April 2019. The price then fell again by about 20 per cent before moving higher to $11.72 in December 2019. OZL needs to break buyer resistance again at around $11 to continue the longer term uptrend. The shares were trading at $10.11 on February 20.
SELL RECOMMENDATIONS
Amcor (AMC)
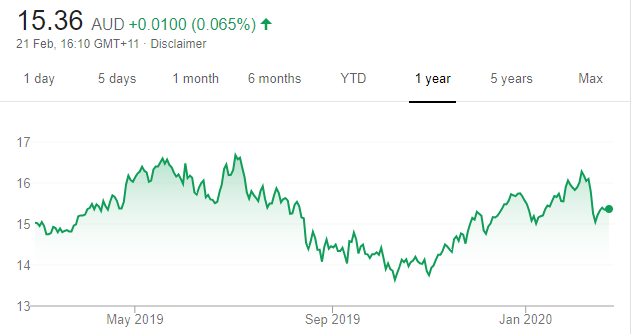
Chart: Share price over the year
The market is looking for more growth from this packaging giant. If it doesn’t materialise, the share price may fall below support to around $14.60 in coming months. If sellers take control, expect the price to be driven lower. The shares have fallen from $16.28 on February 6 to trade at $15.405 on February 20.
Crown Resorts (CWN)
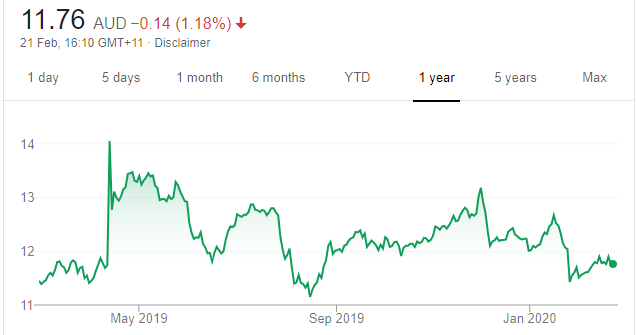
Chart: Share price over the year
From a technical analysis perspective, many exits have been triggered for this casino operator. If the share price was to rise strongly above $13 in the short term, there’s a chance of a recovery. However, from my technical analysis view, CWN appears more likely to fall. If the short sellers push CWN below $11, there will be further share price pressure. The shares were trading at $11.895 on February 20.

Tony Paterno, Ord Minnett
BUY RECOMMENDATIONS
Telstra (TLS)
Chart: Share price over the year
The telecommunications carrier reported a solid interim result. But the result was overshadowed by the Federal Court approving a proposed merger between TPG Telecom and Vodafone Hutchison Australia. Telstra will remain a fierce competitor despite the merge, and we believe the recent share price retreat provides a buying opportunity.
South32 (S32)
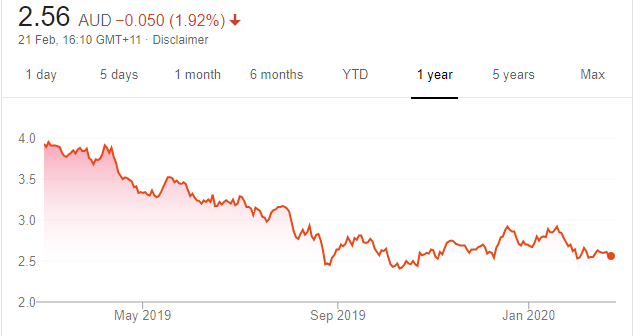
Chart: Share price over the year
This globally diverse mining and metals company reported half year operating earnings that were 6 per cent ahead of our forecasts, and finished the period with $US277 million in net cash. Fiscal year 2020 cost guidance was reduced, driving a 13 per cent increase in our full year EBITDA forecast. We believe the company is well placed to deliver increased capital returns in fiscal year 2021 after selling its South African thermal coal business.
HOLD RECOMMENDATIONS
Carsales.com (CAR)
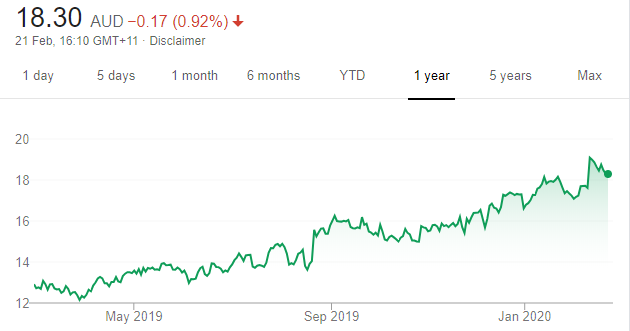
Chart: Share price over the year
The latest interim result was in line with expectations. Carsales.com showed its relative resilience in the core-advertising segment, growing dealer and private revenue by 6 per cent and 7 per cent respectively on the prior corresponding period. However, display revenues were down 5 per cent. CAR appears fully valued.
Suncorp Group (SUN)
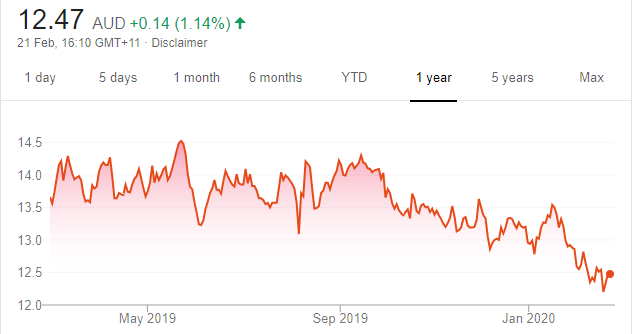
Chart: Share price over the year
This financial services provider recently reported an interim adjusted net profit below our forecast. The interim dividend of 26 cents was higher than our estimate and represented a payout ratio of 89.5 per cent of cash earnings. General insurance margin trends were weak, in our view, although several volume trends were positive. The banking business produced a strong net interest margin, but on weak volumes.
SELL RECOMMENDATIONS
Computershare (CPU)
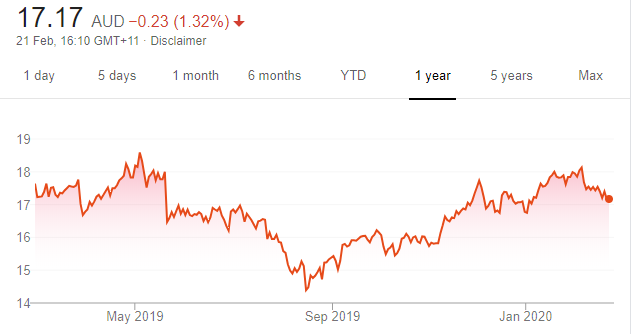
Chart: Share price over the year
Earnings per share were significantly pressured in the 2020 first half. Consequently, we lack confidence in its revised guidance. In our view, the stock offers only modest organic growth. Shares in this share registry business have fallen from $18.13 on February 6 to close at $17.40 on February 20.
Magellan Financial Group (MFG)
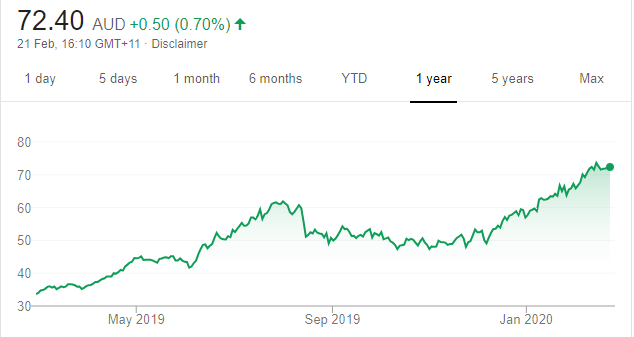
Chart: Share price over the year
The global fund manager’s first half 2020 result was marginally ahead of expectations. Funds management profit before tax rose 24 per cent to $279 million. It was driven by strong flows and market returns that lifted average funds under management by 29 per cent to $92.8 billion. Although the second half has started strongly, we struggle to see valuation support given the estimated price/earnings multiples at these levels.
The above recommendations are general advice and don’t take into account any individual’s objectives, financial situation or needs. Investors are advised to seek their own professional advice before investing.
Please note that TheBull.com.au simply publishes broker recommendations on this page. The publication of these recommendations does not in any way constitute a recommendation on the part of TheBull.com.au. You should seek professional advice before making any investment decisions.