
Copy the success of the pro traders and enjoy a 50% deposit bonus

Michael Gable, Fairmont Equities
BUY RECOMMENDATIONS
Macquarie Group (MQG)
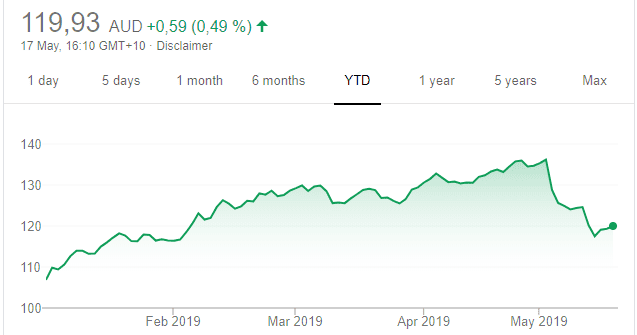
Chart: Share price over the year
The share price has fallen in the past few weeks due to a conservative full year result and general market jitters. We believe markets will recover from around these levels. With MQG recently trading back near crucial support levels, we believe current prices represent a buying opportunity for longer term investors. Shares in the diversified financial group were trading at $118.74 on May 16.
Atlas Arteria (ALX)
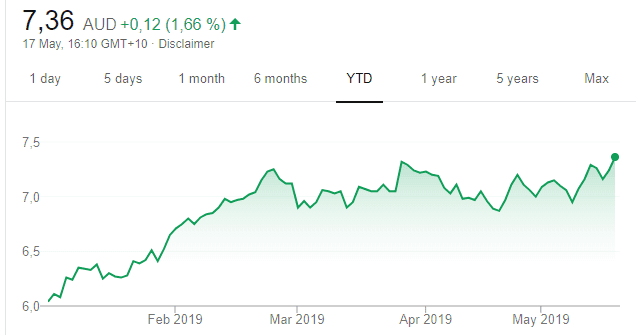
Chart: Share price over the year
This global toll road operator generates reliable earnings. From a charting perspective, it’s been in an uptrend for years. Recent price action is telling us there’s renewed interest in the stock and we expect the share price to continue heading higher from here. The shares were trading at $7.21 on May 16.
HOLD RECOMMENDATIONS
FlexiGroup (FXL)
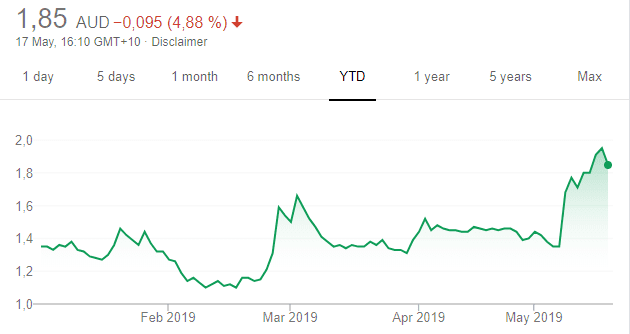
Chart: Share price over the year
We recommended investors consider buying this diversified financial services firm in March. We concluded it’s a turnaround story with plenty of upside potential. The company is out of its downgrade cycle and is signing up new customers. Despite the recent jump in share price, we believe there’s further upside in the next 12 months.
Fortescue Metals Group (FMG)
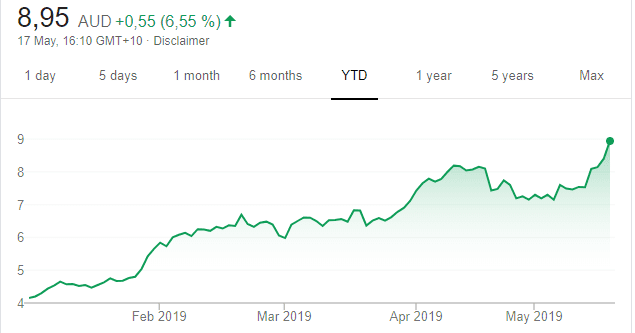
Chart: Share price over the year
Continuing disruption to Vale’s iron ore operations after a dam disaster in Brazil earlier this year provides support to Australia’s iron ore miners. FMG looks bullish on the price chart. The shares soared on May 14 after the company announced a substantial increase in its fully franked dividend, bringing a full year payout to 90 cents a share for 2018-19. The shares were trading at $8.37 on May 16.
SELL RECOMMENDATIONS
Cimic Group (CIM)
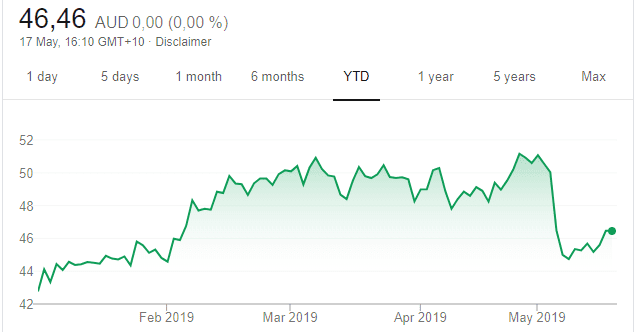
Chart: Share price over the year
In our view, the share price will remain under pressure. The stock bounced off recent lows after the company confirmed it was complying with disclosure obligations and accounting standards. Investors can take advantage of the bounce and move on. Shares in the constriction giant were trading at $46.33 on May 16.
Bank of Queensland (BOQ)
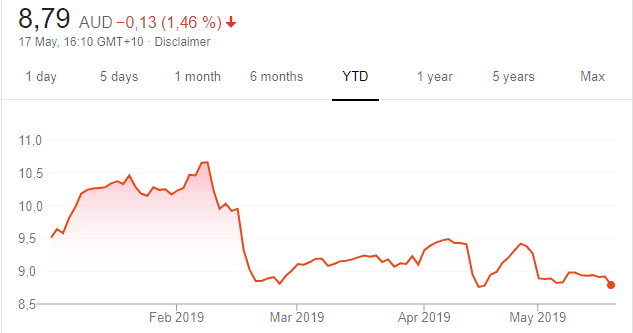
Chart: Share price over the year
Top Australian Brokers
- Pepperstone - multi-asset Australian broker - Read our review
- eToro - market-leading social trading platform - Read our review
- IC Markets - experienced and highly regulated - Read our review
In our view, the shares are still expensive at current levels. The share price is trading near a support level. But recent price action is telling us that it’s likely to break support and continue lower towards $8. The shares were trading at $8.90 on May 16.

David Thang, PhillipCapital
BUY RECOMMENDATIONS
BidEnergy (BID)
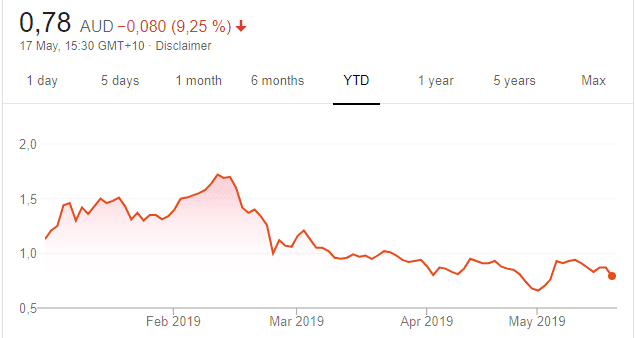
Chart: Share price over the year
An Australian technology company, with operations also in New Zealand, the UK and US. It provides corporate customers with a complete energy spend management solution, which is powered by robotic automation via the cloud. It’s expected BID will be cash flow positive in the December quarter this year, so a re-rating is possible. The shares were priced at 83 cents on May 16.
Smartgroup Corporation (SIQ)
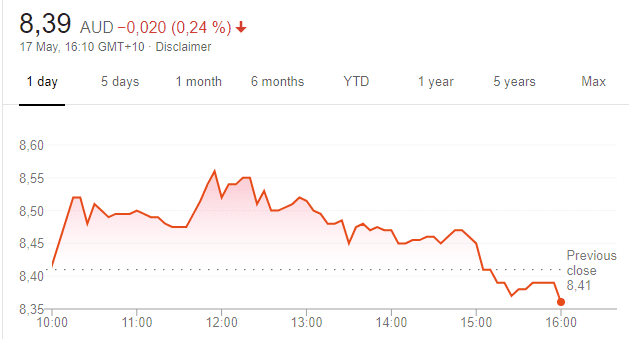
Chart: Share price over the year
The share price of this administrative outsourcing group has fallen from above $13 in August 2018 to trade at $8.37 on May 16. Support was evident at $7.28 in April and positive momentum has returned. The company was recently trading on a respectable fully franked dividend yield of about 5 per cent. SIQ is attractive on valuation grounds.
HOLD RECOMMENDATIONS
Macquarie Group (MQG)
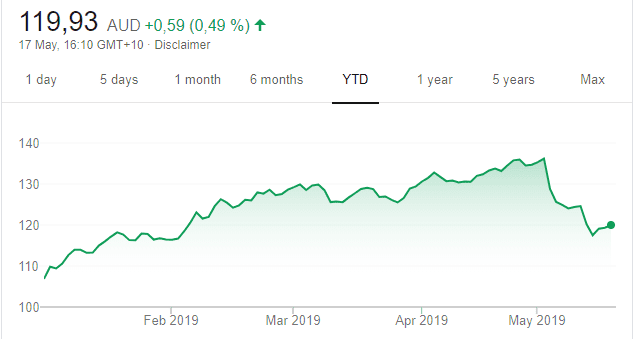
Chart: Share price over the year
A best of breed in the financial services sector, with consistent double digit annual earnings growth. An added bonus is the company’s recent dividend yield of 4.8 per cent, which is 45 per cent franked. The stock is undergoing a short term price correction, but, in, our view, the long term uptrend remains firmly in play.
FlexiGroup (FXL)
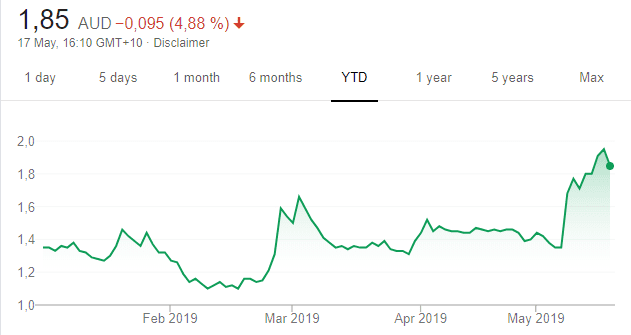
Chart: Share price over the year
This diversified financial services group and competitor to Afterpay Touch Group (APT) has added IKEA, Myer and several health providers to its humm platform. We would expect the company to continue gaining market share in this space.
SELL RECOMMENDATIONS
BHP Group (BHP)
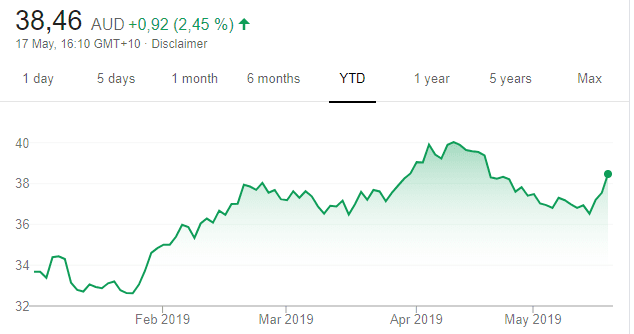
Chart: Share price over the year
After recording a 52 week high of $40.13 on April 9 this year, the global miner has since retreated to trade at $37.47 on May 16. The year low was $29.06 on November 28, 2018. In the absence of any positive catalyst, investors can consider taking a profit.
Flight Centre (FLT)
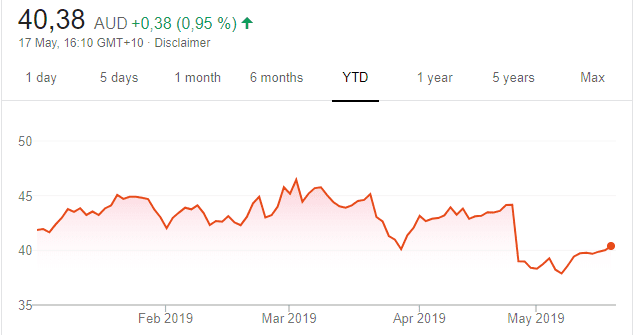
Chart: Share price over the year
The share price plunged after the global travel agency downgraded profit guidance in April for the 2018/19 fiscal year. Subdued trading conditions in the Australian leisure division presents a challenging environment. Best to look elsewhere. The 52 week high was $68.20 on August 20 last year. The shares were trading at $39.91 on May 16.

Theo Karantzias, Equity Underwriters
BUY RECOMMENDATIONS
Lendlease Group (LLC)
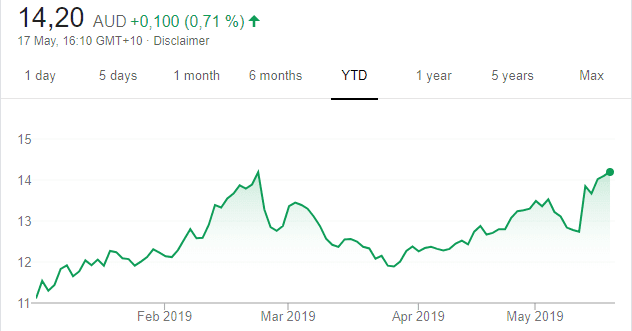
Chart: Share price over the year
The stock price surged on speculation of potential corporate activity. On May 13, LLC responded by saying it hadn’t received any approach. Nevertheless, this international property and infrastructure group has operations in Australia, Asia, Europe and the Americas. What I find appealing is its future development pipeline of about $83 billion. LLC shares have risen from $12.78 on May 9 to close at $14.10 on May 16.
APN Industria REIT (ADI)
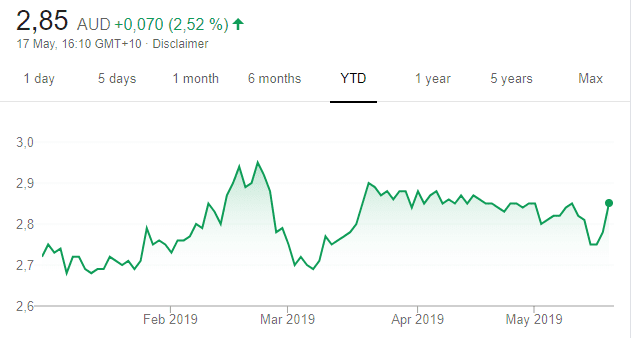
Chart: Share price over the year
Owns interests in office and industrial properties in major Australian cities. The company recently completed an institutional placement, raising $30 million to fund the purchase of four industrial warehouses. The warehouses are 100 per cent leased and should generate an initial yield of 6.3 per cent, underpinned by a four year weighted average lease expiry. Future rental upside exists.
HOLD RECOMMENDATIONS
Ansell (ANN)
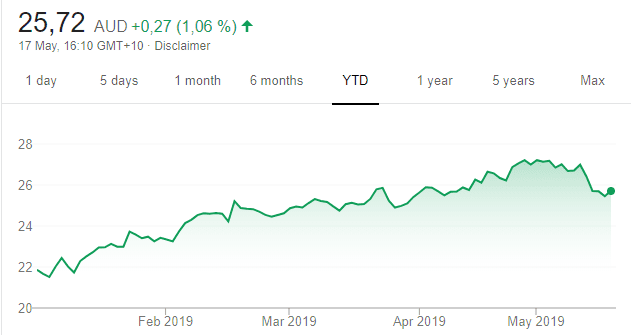
Chart: Share price over the year
This safety protection solutions provider recently announced it would spend $US32 million over the next two years expanding its Thailand manufacturing facility. This will enable the company to increase plant capacity by 30 per cent to meet growing demand for chemical protection platform products. The shares have risen from $21.07 on January 4 to close at $25.45 on May 16. The risk is that any slowing global economic growth may pressure earnings.
Australian Mines (AUZ)
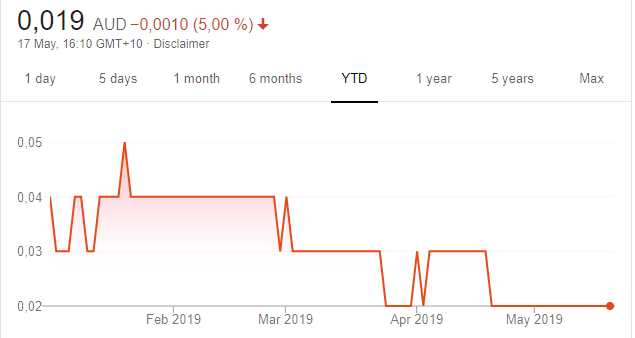
Chart: Share price over the year
The company is developing cobalt-scandium-nickel projects in Australia. It released a rather solid bankable feasibility study and further announcements describing its expansion into the cobalt market. The company has an experienced board. The shares closed at 2 cents on May 16.
SELL RECOMMENDATIONS
Commonwealth Bank of Australia (CBA)
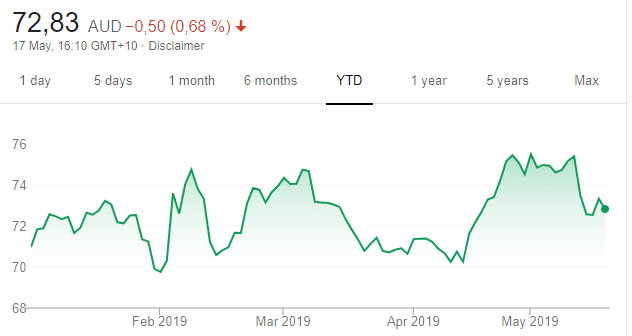
Chart: Share price over the year
The CBA is taking steps to improve customer outcomes. However, in a third quarter trading update on May 13, the bank announced an additional $714 million in pre-tax customer remediation provisions had impacted headline profit. Accordingly, the shares were punished. On May 10, the shares were priced at $75.40. The shares closed at $73.33 on May 16.
IOOF Holdings (IFL)
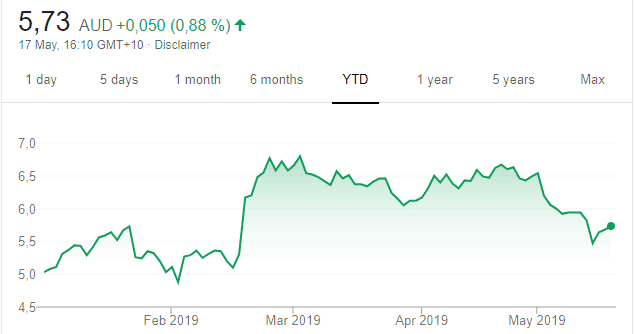
Chart: Share price over the year
The proposed deal to buy ANZ’s superannuation business may face regulatory hurdles. This financial services company is up against a class action announced in April, which it intends to defend. In December, the Australian Prudential Regulation Authority alleged IOOF had failed to act in the best interests of superannuation members. The company announced it would defend the allegations. The fallout from the banking Royal Commission will take time to repair. The share price has been struggling and closed at $5.68 on May 16.
Please note that TheBull.com.au simply publishes broker recommendations on this page. The publication of these recommendations does not in any way constitute a recommendation on the part of TheBull.com.au. You should seek professional advice before making any investment decisions.