

Chris Conway, Marcus Today,
BUY RECOMMENDATIONS
Super Retail Group (SUL)
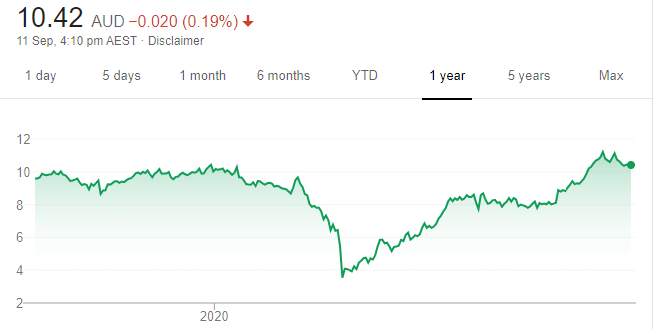
Chart: Share price over the year
The retail giant delivered a good full year 2020 result. Auto and Rebel brand margins expanded in the second half. Supercheap Auto is outperforming, as motorists spend more money on servicing and improving their vehicles. Demand for domestic travel, leisure and sporting activities contributed to the result, and also paint a bright outlook in fiscal 2021.
Magellan Financial Group (MFG)
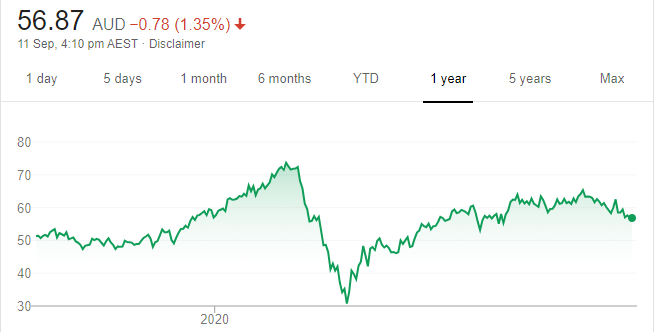
Chart: Share price over the year
The global fund manager posted fiscal year 2020 results that were broadly in line with expectations. Management fees were up 25 per cent on the previous corresponding period. Average funds under management rose 26 per cent to $95.5 billion. The final dividend was up 10 per cent to $1.22. MFG growth initiatives, such as leveraging its growing retail client base and strong balance sheet, could deliver significant medium term growth in funds under management.
HOLD RECOMMENDATIONS
Crown Resorts (CWN)
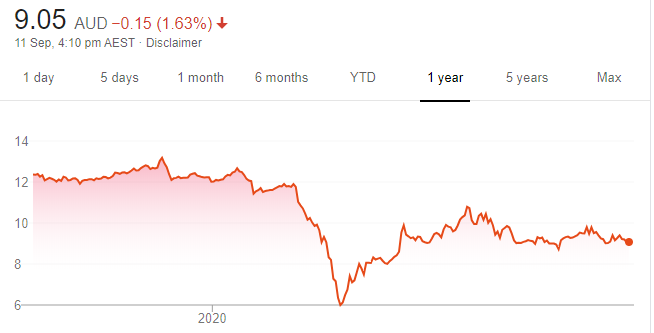
Chart: Share price over the year
The fiscal year 2020 result was heavily impacted by COVID-19 and closure costs, but was in line with prior guidance. Upside potential exists after Victoria lifts lockdown restrictions and when international borders eventually re-open. Between July 1 and August 20, Crown Perth’s main gaming floor revenue – excluding VIP program play revenue – was up about 18 per cent on the prior corresponding period. This provides a glimpse of potentially brighter future.
Nanosonics (NAN)
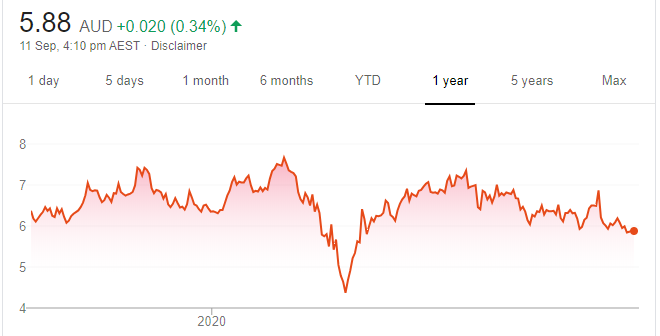
Chart: Share price over the year
NAN makes the trophon EPR ultrasound probe disinfector. Limited access to hospitals due to COVID-19 impacted the full year 2020 result. Despite ongoing uncertainties associated with the pandemic, the underlying business fundamentals remain strong. The share price was punished in response to the result and may provide a longer term opportunity.
SELL RECOMMENDATIONS
Seven West Media (SWM)
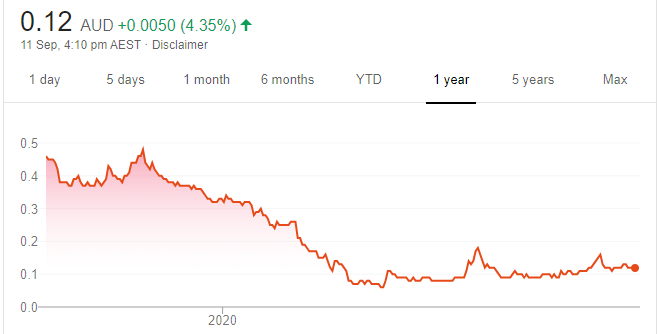
Chart: Share price over the year
Fiscal year 2020 operating revenue fell 14 per cent to $1.228 billion. Earnings before interest and tax slumped 53.6 per cent to $98.7 million. The pandemic led to a weaker advertising market. The media giant has sold several assets to reduce its debt burden. SWM operates in a continually disrupted market, with streaming services pressuring free-to-air television revenues.
ResMed Inc (RMD)
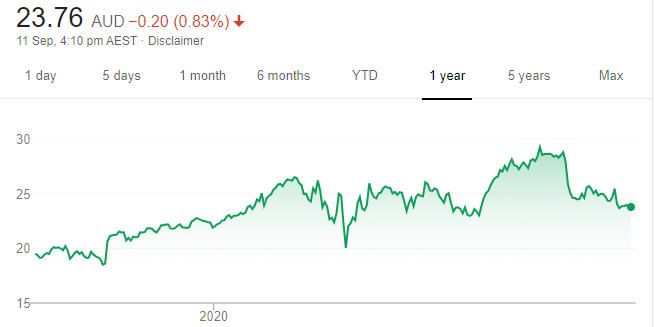
Chart: Share price over the year
This medical device maker has been one of our favourites, but we believe the time has arrived for investors to consider selling. The stock was sold down sharply on what we believe were modest full year 2020 results. Stiffer competition in the US could lead to lower retail prices. In our view, the stock is trading on elevated multiples despite slowing demand for sleep apnoea treatment during the economic downturn.
Top Australian Brokers
- Pepperstone - multi-asset Australian broker - Read our review
- eToro - market-leading social trading platform - Read our review
- IC Markets - experienced and highly regulated - Read our review

Tony Paterno, Ord Minnett
BUY RECOMMENDATIONS
The Star Entertainment Group (SGR)
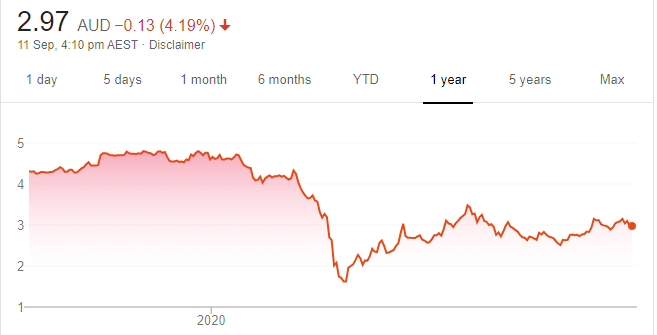
Chart: Share price over the year
SGR operates casinos in Sydney, Brisbane and on the Gold Coast. We expect domestic tourism and spending to recover before international travel. The competitive risk has abated, as plans for a second casino on the Gold Coast have been shelved. Competitor Crown’s VIP business has been hampered due to the pandemic.
National Australia Bank (NAB)
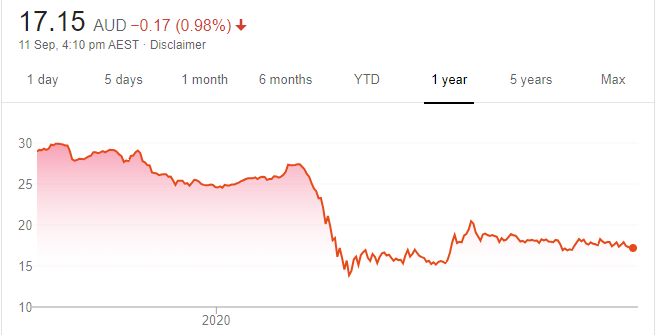
Chart: Share price over the year
The NAB recently announced an agreement to sell MLC Wealth to IOOF Holdings for $1.4 billion. The sale enhances NAB’s capital buffer to manage COVID-19 related pressures. The Reserve Bank of Australia is extending support to deposit taking institutions via its term funding facility. In our view, the shares are trading at relatively low levels. The stock finished at $17.32 on September 10.
HOLD RECOMMENDATIONS
Coles Group (COL)
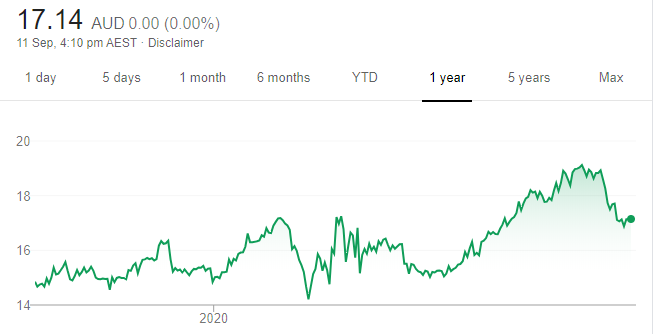
Chart: Share price over the year
The supermarket giant delivered a 6.9 per cent increase in sales revenue to $37.4 billion for fiscal year 2020. Net profit after tax, excluding significant items, was up 7.1 per cent to $951 million. Online margins surprised to the upside. The company continues to work on improving the customer online experience.
AMP (AMP)
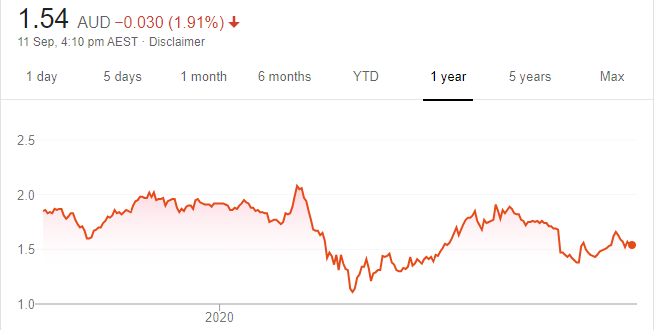
Chart: Share price over the year
The embattled wealth manager is undertaking a portfolio review of its group assets and businesses. The board says it remains committed to the transformation strategy, but had recently received an increased level of unsolicited interest in its assets and businesses. It will consider its options and evaluate the relative merits, including potential separation and other costs. Shareholders can consider holding for updates.
SELL RECOMMENDATIONS
Treasury Wine Estates (TWE)
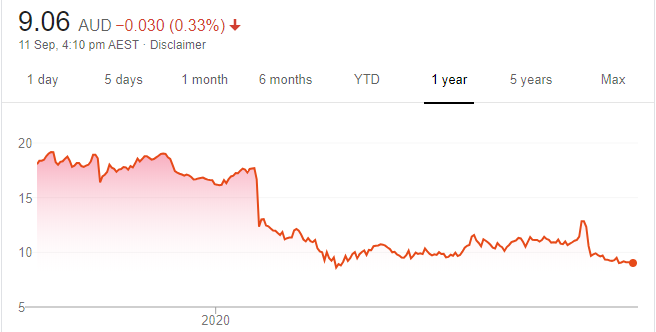
Chart: Share price over the year
China’s Ministry of Commerce announced it had begun an anti-dumping investigation into wine imports from Australia. China is the largest export market for Australian wine. Most of TWE’s earnings growth has been generated in Asia. In our view, the anti-dumping investigation is shaping up as a headwind for TWE moving forward.
Northern Star Resources (NST)
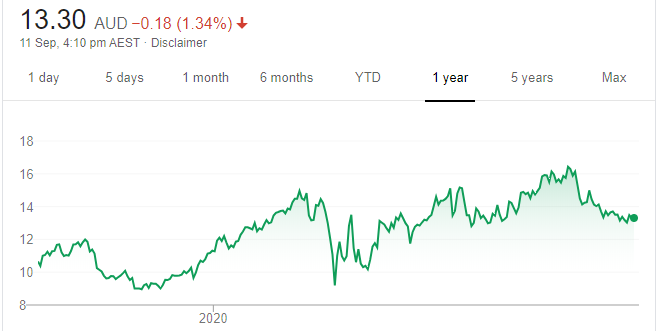
Chart: Share price over the year
Gold prices have been strong on the back of global uncertainty, but we believe they are close to a peak. NST’s share price has enjoyed a strong run in calendar year 2020, rising from a 52-week low of $8.74 on March 16 to close at $13.48 on September 10. Full year 2020 underlying net profit after tax was up 69 per cent to $291 million. In our view, NST is exposed to downside risk on valuation grounds.

Giuliano Sala Tenna, Bell Potter Securities
BUY RECOMMENDATIONS
Gold Road Resources (GOR)
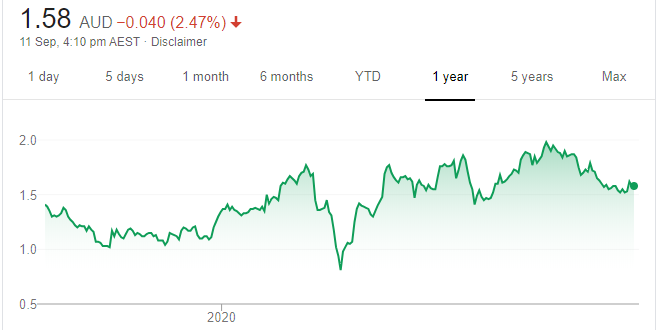
Chart: Share price over the year
Its principal asset is a 50 per cent interest in the Gruyere Gold Project in Western Australia. The joint venture produces 300,000 ounces a year. The Gruyere project has a total gold resource base of 6.6 million ounces at an average grade of 1.32 grams, and is a long life, low cost open pit operation currently in ramp up phase. GOR has a $26 million exploration budget in fiscal year 2021 and has no debt on its balance sheet. We’re positive about gold given aggressive quantitative easing programs around the globe. I own shares in GOR.
Mach7 Technologies (M7T)
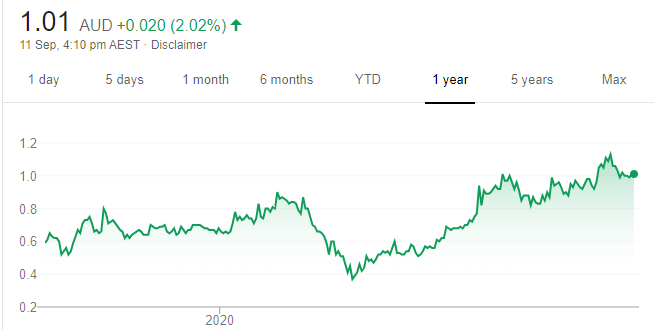
Chart: Share price over the year
The company specialises in medical imaging data management solutions. M7T achieved cash flow breakeven in fiscal year 2020, which is a critical milestone for a high growth company. It operates in hospitals and medical facilities across the globe and has an active pipeline of tenders driving future growth. We believe M7T could become the next market darling in the medical technology sector. A speculative buy. I own shares in M7T.
HOLD RECOMMENDATIONS
Sonic Healthcare (SHL)
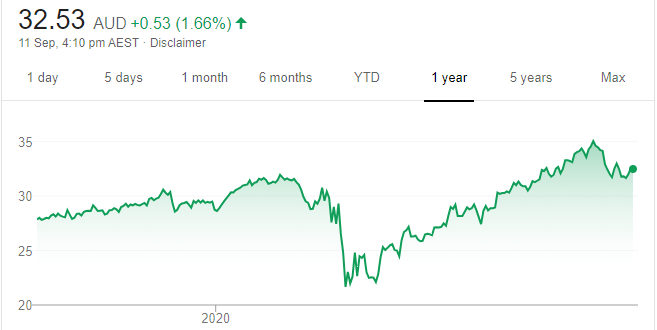
Chart: Share price over the year
Sonic provides medical diagnostic services throughout Australia, New Zealand, North America and Europe. The company reported an 11.5 per cent increase in underlying revenue to $6.8 billion in fiscal year 2020. Underlying net profit grew 6.5 per cent to $552 million. The company remains better positioned than many other large cap healthcare counterparts, in our view. I own shares in SHL.
Tyro Payments (TYR)
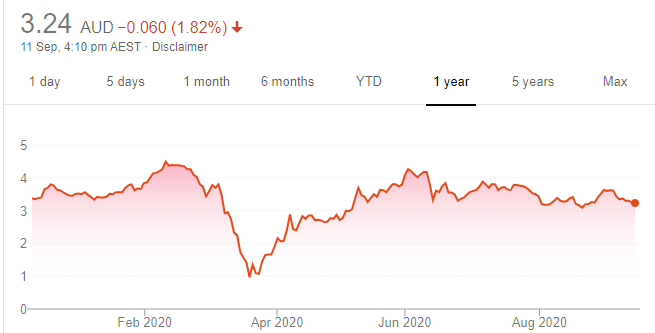
Chart: Share price over the year
Weekly updates during the COVID-19 crisis confirm this payment solutions and banking business products provider has returned to top line growth. We believe TYR is a long term disruptor, with a superior payments product at a lower price, providing it with a long runway of growth. I own shares in TYR.
SELL RECOMMENDATIONS
Lovisa Holdings (LOV)
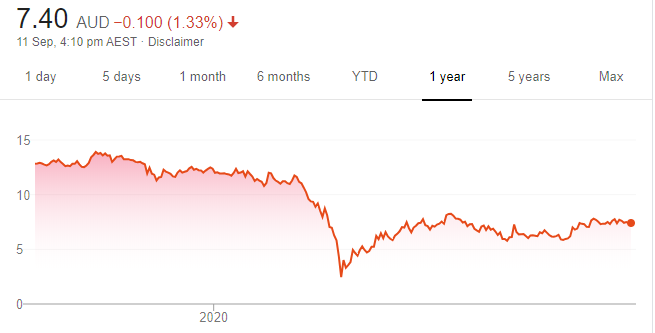
Chart: Share price over the year
The financial metrics of this fashion jewellery and accessories retailer were impacted by COVID-19 in fiscal year 2020. Revenue was down 3.2 per cent to $242.2 million, while net profit after tax slumped 47.8 per cent to $19.3 million. We see a reduction in Federal Government fiscal stimulus and a return to mortgage repayments as headwinds.
JB Hi-Fi (JBH)
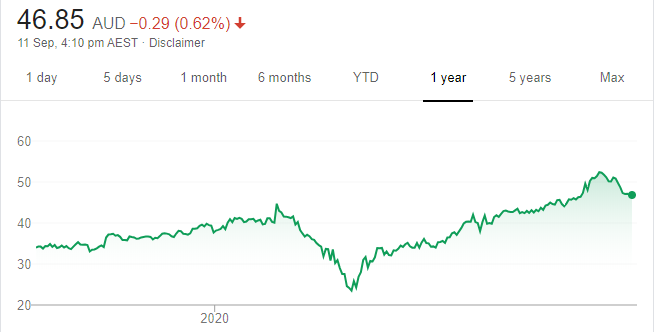
Chart: Share price over the year
This consumer electronics giant is a well-run business that’s achieved strong sales metrics. With believe the imminent winding back of government fiscal stimulus will impact discretionary retailers at the end of the December and March quarters. JBH shares have performed strongly in calendar year 2020, so investors may want to consider taking a profit.
The above recommendations are general advice and don’t take into account any individual’s objectives, financial situation or needs. Investors are advised to seek their own professional advice before investing. Please note that TheBull.com.au simply publishes broker recommendations on this page. The publication of these recommendations does not in any way constitute a recommendation on the part of TheBull.com.au. You should seek professional advice before making any investment decisions.