

Tom Bleakley, BW Equities
BUY RECOMMENDATIONS
IDT Australia (IDT)
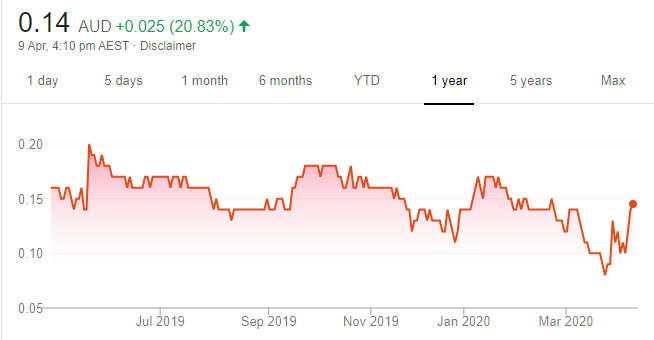
Chart: Share price over the year
IDT is an Australian pharmaceutical company, with extensive experience in developing and producing high potency and high containment products. IDT recently announced that the Australian Government had requested its assistance with certain Coronavirus response activities. We know going forward there will be a government focus on ensuring Australia has local manufacturing capacity for strategic pharmaceuticals.
Marley Spoon AG (MMM)
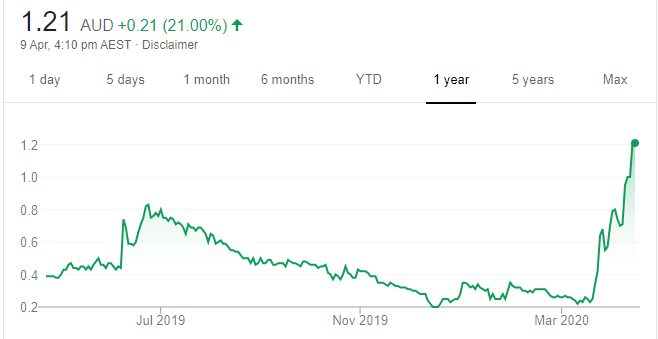
Chart: Share price over the year
Marley Spoon delivers fresh ingredients and recipes to the door, so people can cook at home. It operates in Australia, Europe and the US. The Coronavirus and government countermeasures have led to a surge in demand for Marley Spoon’s home delivered meal kits in all markets. Revenue is rising and customer acquisition and marketing costs are falling. The company is positively leveraged to the current economic climate, giving it scope to continue building a successful business for years to come. The share price has risen from 25 cents on March 18 to close at $1.21 on April 9.
HOLD RECOMMENDATIONS
McPherson’s (MCP)
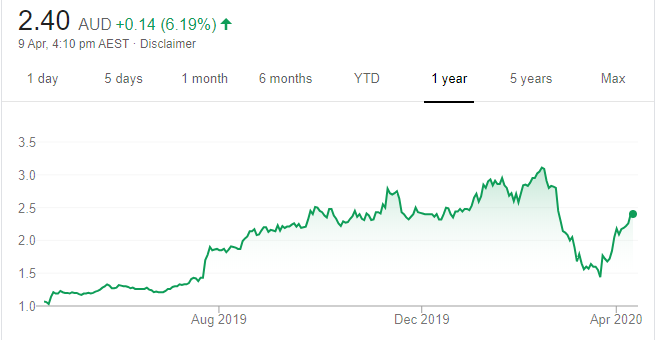
Chart: Share price over the year
Markets and distributes health, beauty, household and personal care products in Australia and China. Panic buying in Australia amid an opening up of China’s economy leave MCP in a position to meet fiscal year 2020 guidance of a 10 per cent increase in profit before tax on 2019.
Aeris Environmental (AEI)
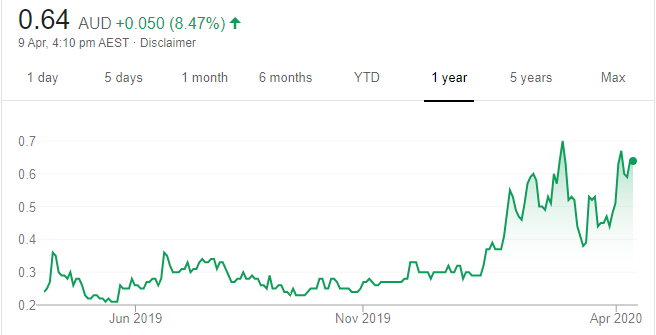
Chart: Share price over the year
This chemical company makes and markets technology that’s environmentally friendly. Significant growth in product demand leaves the company on track to meet sales forecasts of $10 million in the 2020 second half compared to $3.225 million in the first half. The company recently completed a $12 million placement to support global growth. I expect Aeris to build a successful business from a world focused on hygiene.
SELL RECOMMENDATIONS
Ardent Leisure Group (ALG)
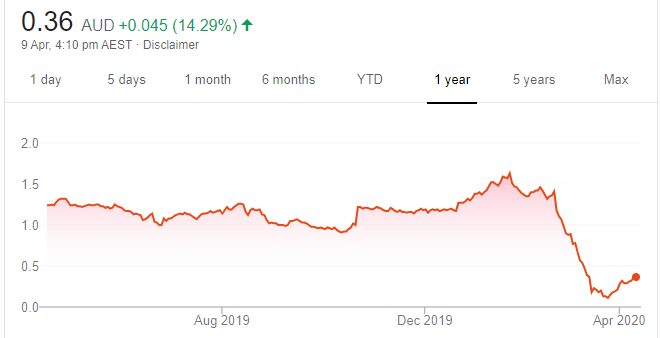
Chart: Share price over the year
Theme parks Dreamworld and WhiteWater World stopped operating on March 23 in response to the Coronavirus. It’s unclear when these venues will re-open. Main Event entertainment centres in the US will remain closed until at least April 30. ALG shares have fallen from $1.355 on February 20 to close at 36 cents on April 9.
Village Roadshow (VRL)
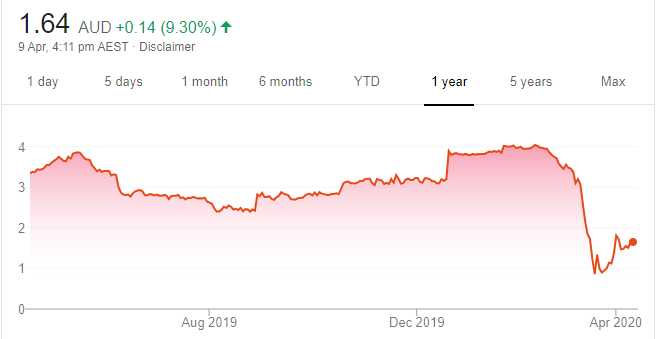
Chart: Share price over the year
VRL is cutting operating costs after closing its Gold Coast theme parks and cinemas on March 23. Companies directly impacted by social distancing rules are under immense pressure as revenue plummets. From an investment perspective, VRL faces too much uncertainty in a Coronavirus world raising more questions than answers.
Top Australian Brokers
- Pepperstone - multi-asset Australian broker - Read our review
- eToro - market-leading social trading platform - Read our review
- IC Markets - experienced and highly regulated - Read our review

Janine Cox, Wealth Within
BUY RECOMMENDATIONS
Rio Tinto (RIO)
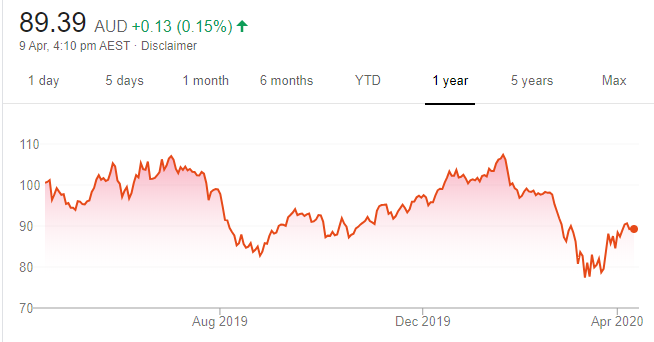
Chart: Share price over the year
The sharemarket is yet to confirm a low, and it may take four to six weeks before a direction emerges. Buying any stock at this time is high risk. However, RIO still deserves a place on the watch list. The price has fallen from a 52 week high of $107.79 on January 22 to close at $89.39 on April 9. This mining giant is holding up relatively well compared to the broader market.
BHP Group (BHP)
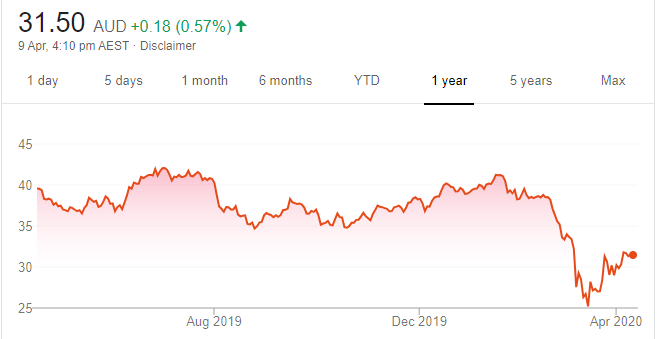
Chart: Share price over the year
This global miner still stacks up as a long term opportunity. Although it’s been rising in recent weeks, buying it is still a bet at this time. The time to buy is after the punters test the first bounce and this move is currently unfolding. In my view, BHP will probably retreat in the short term to test the conviction of sellers before rising. If it continues to fall, simply wait for a better time to buy.
HOLD RECOMMENDATIONS
Cochlear (COH)
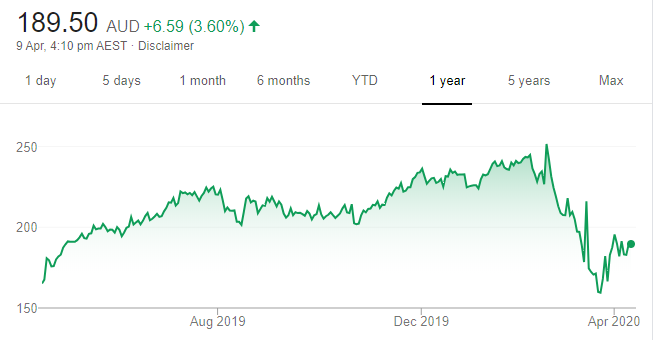
Chart: Share price over the year
This hearing implants maker successfully completed an $880 million placement to institutional investors at $140 a share. A share purchase plan is now available to retail investors. Beware, as participating in the plan may drive the April 9 closing price of $189.50 towards the offer price in the short term. Buying any stock in current market conditions is high risk, even if it’s a good company offering a discount. A fall below $165 would change my current view to a sell.
Silver Lake Resources (SLR)
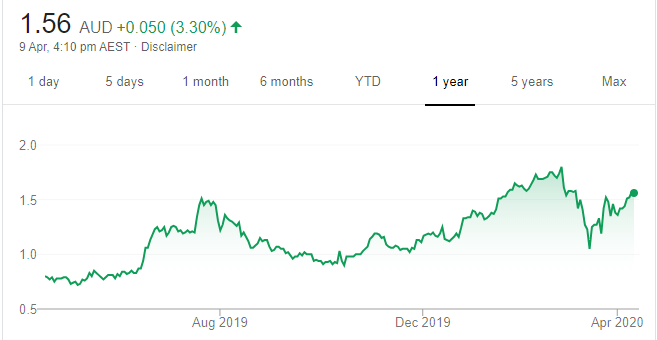
Chart: Share price over the year
Significant psychological resistance exists around $1.60 for this gold producer. If SLR can break above this level, it’s likely to continue higher to about $2 in the short term. The shares finished at $1.565 on April 9. Alternatively, we move to a more bearish stance if the price trades below $1.35. Keep an eye on SLR.
SELL RECOMMENDATIONS
ANZ Bank (ANZ)
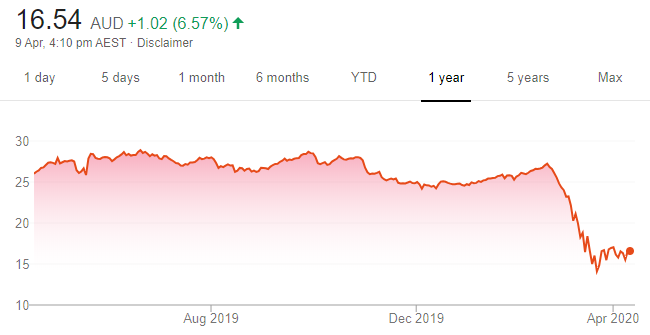
Chart: Share price over the year
In our view, risk remains strongly to the downside in the medium term. Provided ANZ holds above the low of $14.10 in March 2020, it may recover in the short term. However, in our view, the risk of further falls remains high and ANZ may trade below $14.10 in coming months. If this occurs, we believe ANZ is likely to fall significantly more. The shares finished at $16.54 on April 9.
QBE Insurance Group (QBE)
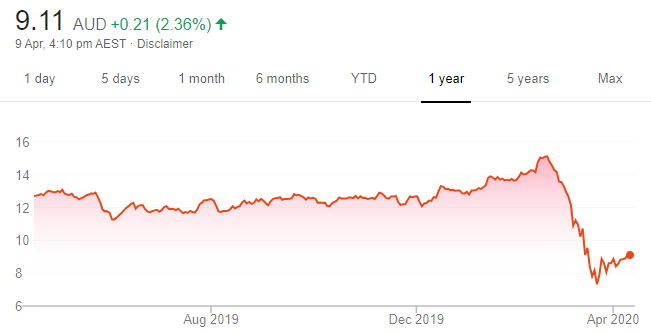
Chart: Share price over the year
QBE is one in a long line of stocks to recently fall to long term lows. The company has bounced off its 52 week low of $7.13 on March 23 to finish at $9.11 on April 9. Prior to the pandemic, QBE had maintained a trading range between $9.50 and $15 for numerous years. The risk of further falls from here remains high if QBE fails to close strongly above $9.50 in the weeks ahead.

Michael McCarthy, CMC Markets
BUY RECOMMENDATIONS
CSL (CSL)
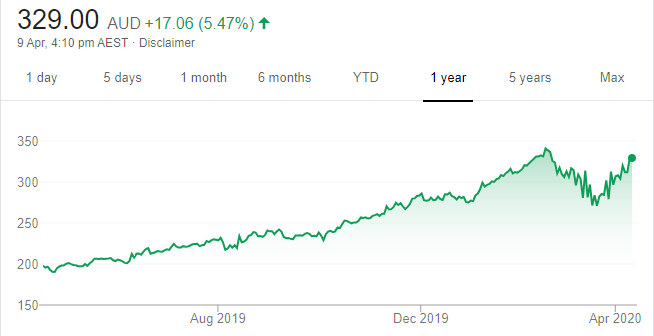
Chart: Share price over the year
It’s not the time to buy any stock, in my opinion. The market remains disrupted by wild swings, huge trading ranges and big volumes. Studies show that big single day gains usually occur in the midst of a bear market, so daily index gains of between 4 per cent and 7 per cent are just as concerning as 5 per cent falls. If investors are considering buying, I’d look for stocks with strong balance sheets, good moats and prices falling less than the market average. CSL fits this bill.
Beach Energy (BPT)
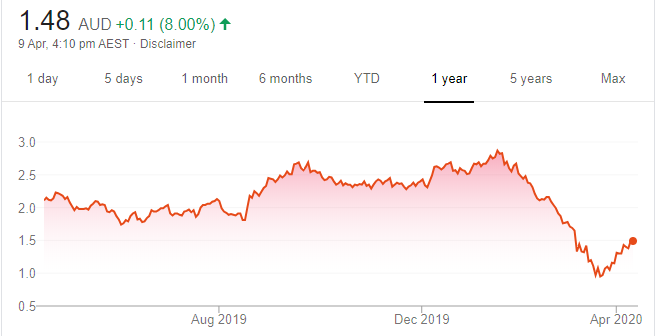
Chart: Share price over the year
Those who insist on buying at the moment could look at BPT. Energy stocks are most unpopular amid crude oil prices falling by about 65 per cent in three months. Further, BPT could be a major beneficiary of the Victorian Government lifting a ban on conventional onshore gas exploration and development from July 1, 2021.
HOLD RECOMMENDATIONS
Commonwealth Bank of Australia (CBA)
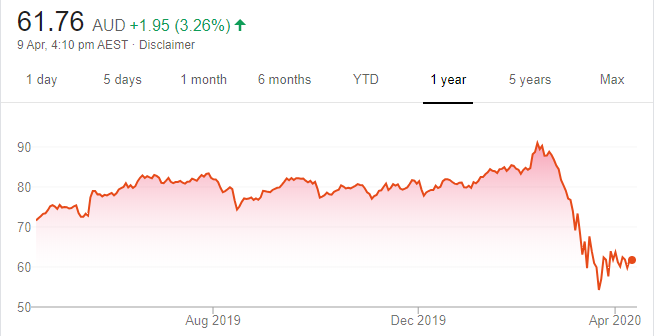
Chart: Share price over the year
Bad debts are likely to rise and dividends could fall. However, the Federal Government’s lending support package for small and medium sized businesses is a source of growth at lower risk.
NextDC (NXT)
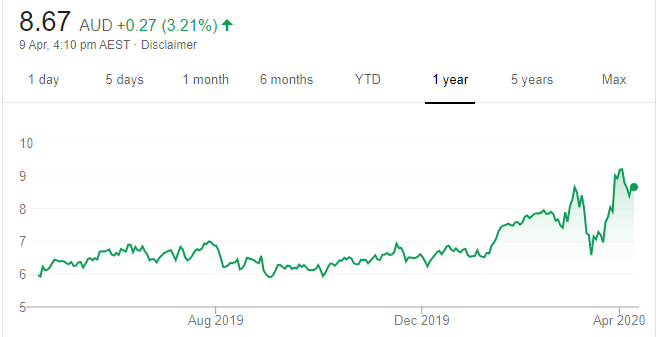
Chart: Share price over the year
This data services centre builder and operator recently enjoyed a share price surge to all time highs on the back of huge demand from people working at home. NXT is one of a handful of beneficiaries during this viral disruption. Future debt requirements could be at much lower levels due to a big boost in cash flows.
SELL RECOMMENDATIONS
Qantas Airways (QAN)
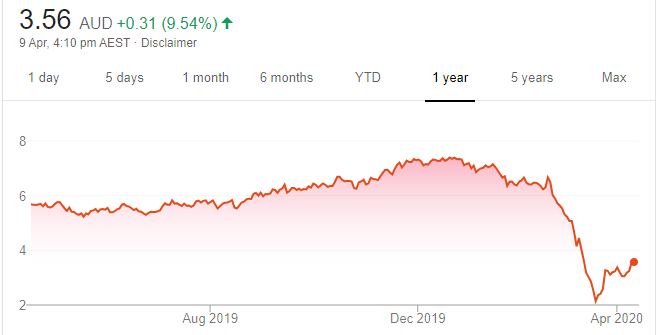
Chart: Share price over the year
During the past three years, Qantas stood out as a well-run business in a tough operating environment. Shareholders reaped the rewards until January. But since early January, the share price has halved due to the Coronavirus. Kick-starting a closed industry presents challenges. Aviation isn’t simply a turn-the-key business. It could potentially take four or five years before Qantas activity returns to levels prior to the Coronavirus.
Metcash (MTS)
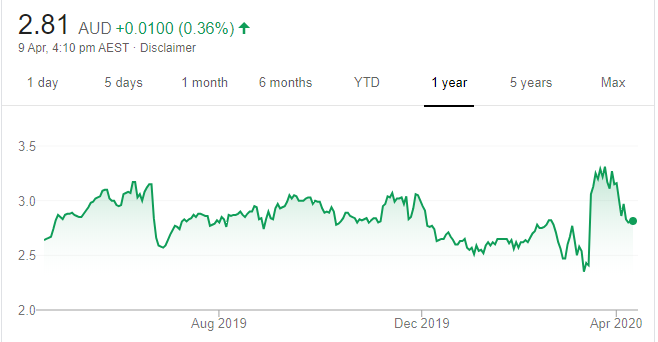
Chart: Share price over the year
The company has outperformed as the supermarket division has benefited from shoppers stocking their pantries. However, in my view, this is a temporary response, as stronger demand for groceries has been brought forward. Fierce competition from rivals Coles and Woolworths presents a significant challenge when demand returns to normal. Investors could consider taking advantage of recent and relative share price strength by locking in some profits.
The above recommendations are general advice and don’t take into account any individual’s objectives, financial situation or needs. Investors are advised to seek their own professional advice before investing.
Please note that TheBull.com.au simply publishes broker recommendations on this page. The publication of these recommendations does not in any way constitute a recommendation on the part of TheBull.com.au. You should seek professional advice before making any investment decisions.