
See our brand new top 10 broker reviews. Find your perfect platform!

Elio D’Amato, Lincoln Indicators
BUY RECOMMENDATIONS
Pro Medicus (PME)
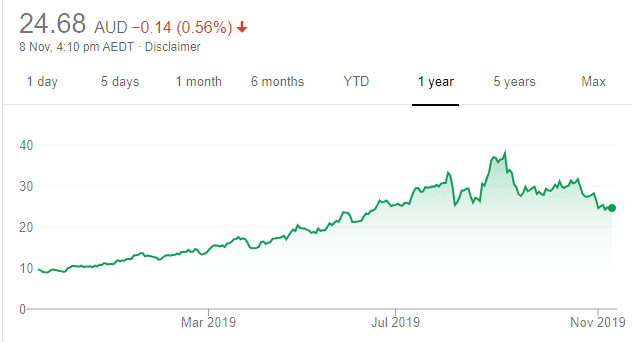
Chart: Share price over the year
PME has enjoyed a stellar run in the past two years. But recently, the share price of this health imaging company experienced a strong pullback as the market avoids high price/earnings ratio stocks in favour of value plays. The softer share price provides an opportunity to consider buying a quality business with a strong global growth theme supported by sector tailwinds and an ongoing contract pipeline.
Saracen Mineral Holdings (SAR)
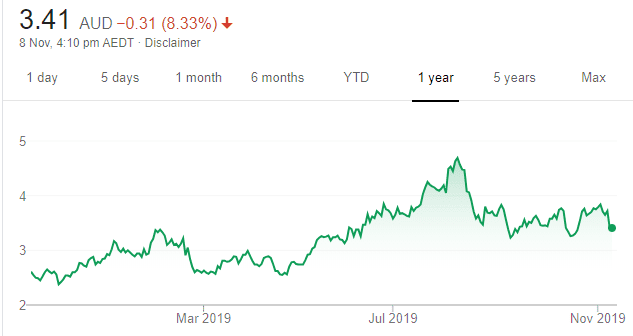
Chart: Share price over the year
SAR is one of our preferred growth stocks, with gold operations in Western Australia. It continues to invest heavily in future exploration and ongoing capital works. Its latest quarterly update confirmed it was ahead of previous production guidance, and all in sustaining costs had significantly fallen. SAR is a good company to consider buying for growth and defensive characteristics.
HOLD RECOMMENDATIONS
Jumbo Interactive (JIN)
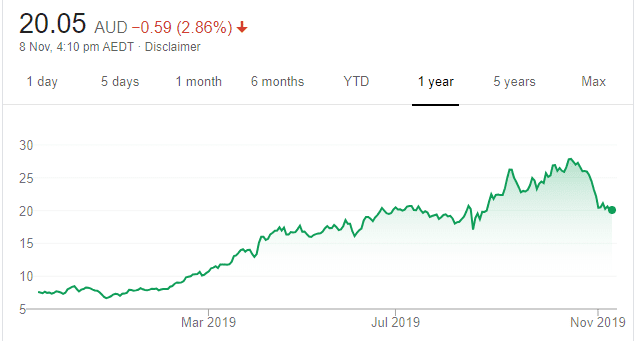
Chart: Share price over the year
Recently, investors took profits in this lotteries software provider. The shares have fallen from a 52 week high of $27.92 on October 17 to trade at $20.56 on November 7. Speculation that JIN is facing potentially more competition in its space had an impact on price, in our view. It may be premature to sell now. JIN’s market penetration is rapidly increasing, and the company is considering other growth avenues for the future.
CSL (CSL)
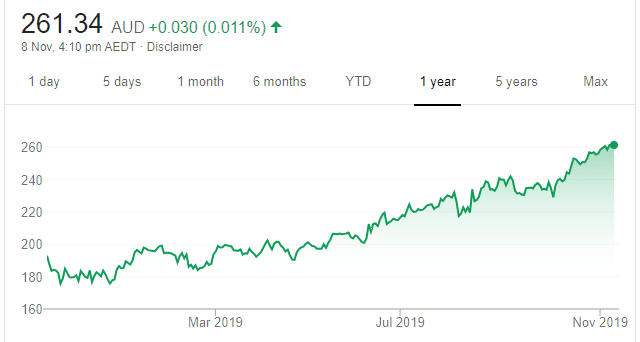
Chart: Share price over the year
The pharmaceutical behemoth continues to be the premier large market capitalisation growth business on our market. Strong demand for its immunoglobulin products, coupled with a big research and development pipeline and imminent product releases, should lead to more growth for this high quality business.
SELL RECOMMENDATIONS
Zip Co (Z1P)
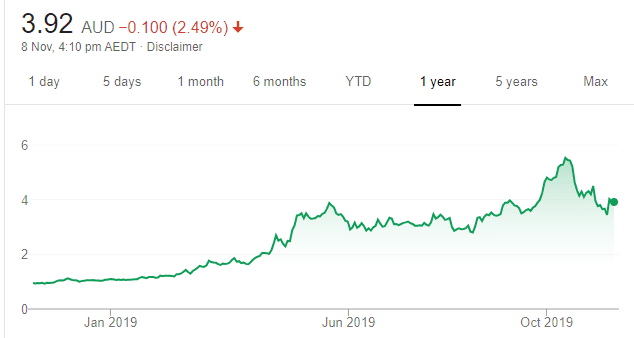
Chart: Share price over the year
The share price of this buy now, pay later platform provider bounced on November 7 after announcing an agreement with Amazon Australia. However, the price is significantly off its 12 month high of $5.86 on October 14, 2019. In our view, recent quarterly revenue growth of 15 per cent isn’t enough to satisfy investors continuing to expect exponential increases. Unless its fundamentals improve quickly, we believe there’s a chance the price will remain under downward pressure. The shares were trading at $4.015 on November 7.
Bank of Queensland (BOQ)
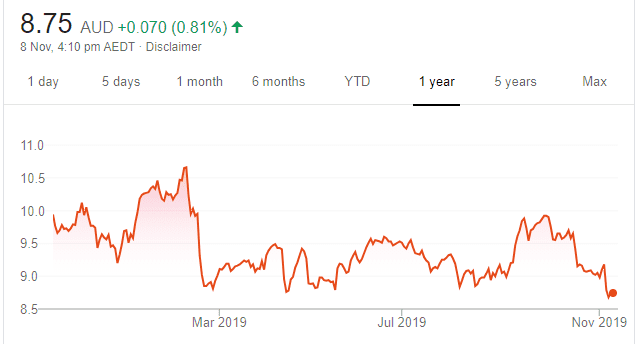
Chart: Share price over the year
Top Australian Brokers
- Pepperstone - multi-asset Australian broker - Read our review
- eToro - market-leading social trading platform - Read our review
- IC Markets - experienced and highly regulated - Read our review
BOQ reported a poor full year 2019 result, in our view. The company highlighted challenging operating conditions, such as slowing credit demand, lower interest rates and increasing regulatory costs. Positive catalysts in the banking sector are difficult to find – at least in the short term. The shares have fallen from $9.92 on September 30 to trade at $8.705 on November 7. The shares may continue to be pressured.

Tim Montague-Jones, ASR Wealth Advisers
BUY RECOMMENDATIONS
Nanosonics (NAN)
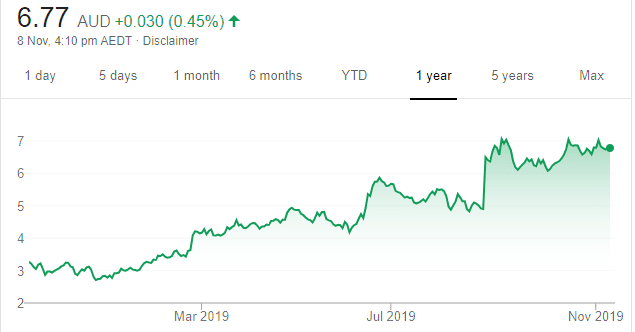
Chart: Share price over the year
The share price has performed strongly as the company exploits its intellectual property within the health care industry. This IP is derived from offering an effective sterilisation method for ultrasound probes. Global health authorities have endorsed the technology as a standard sterilisation practice for ultrasound probes. We expect revenues to grow strongly as it gathers market momentum. The opportunity to leverage this IP to other health care related devices adds another element of hidden value.
Kogan.com (KGN)
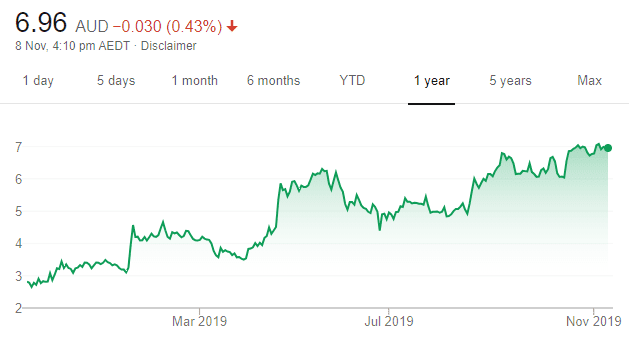
Chart: Share price over the year
Presents an opportunity to own a pure play online retailer as consumers migrate to spending online. KGN has built a brand presence for value in a period of economic weakness. Consumers are increasingly cost conscious and are gravitating towards value brands.
HOLD RECOMMENDATIONS
Sydney Airport (SYD)
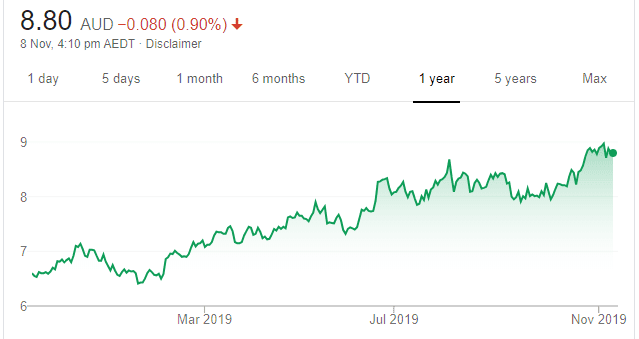
Chart: Share price over the year
This interest rate sensitive stock has benefited from falls in global bond yields. With more than $9 billion of balance sheet debt, falling borrowing costs has a material impact on cash flow, which can then be redirected towards paying dividends. We expect bond yields to remain low for an extended period. In our view, the stock is fully priced.
APA Group (APA)
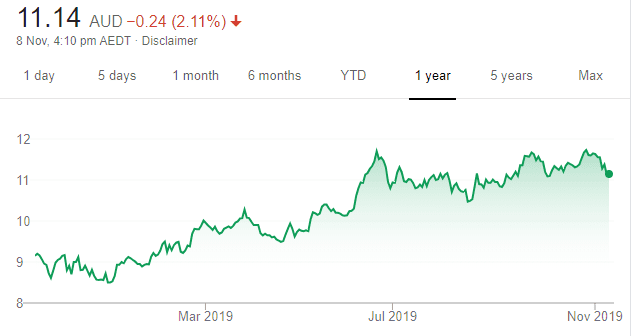
Chart: Share price over the year
APA’s gas transmission pipeline offers regulated stable revenue through the economic cycle. Falling bond yields led many investors to hunt for defensive and stable bond-like proxies, which is what APA offers. We don’t expect bond yields to materially fall from current levels and view APA as fully priced.
SELL RECOMMENDATIONS
Harvey Norman Holdings (HVN)
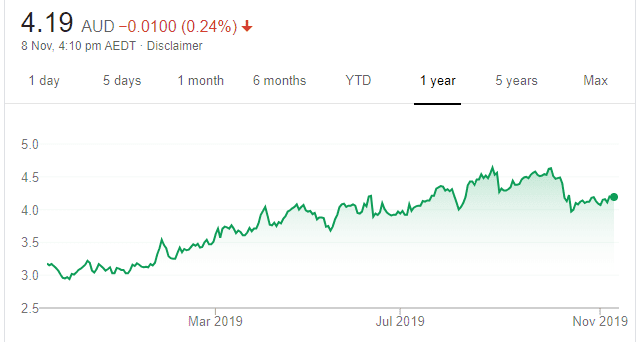
Chart: Share price over the year
Despite falling interest rates, consumers remain on a spending strike because wage increases remain low. The retail giant’s outlook is challenging given the Reserve Bank has little room to move on interest rates. Also, the Federal Government is unlikely to move the budget into deficit to stimulate the economy. In our view, Harvey Norman faces increasing competition from online and other retailers, which can lead to discounting and lower returns for shareholders.
Flight Centre Travel Group (FLT)
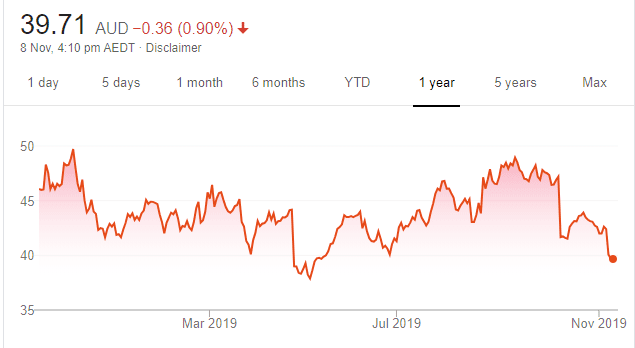
Chart: Share price over the year
Household debt remains elevated. We expect consumers to increasingly re-direct more of their budgets to debt repayments. Cost of living increases will also constrain family budgets. We believe economic constraints on business and households may pressure FLT revenues and earnings going forward.

Nathan Lodge, Lodge Partners
BUY RECOMMENDATIONS
Mesoblast (MSB)
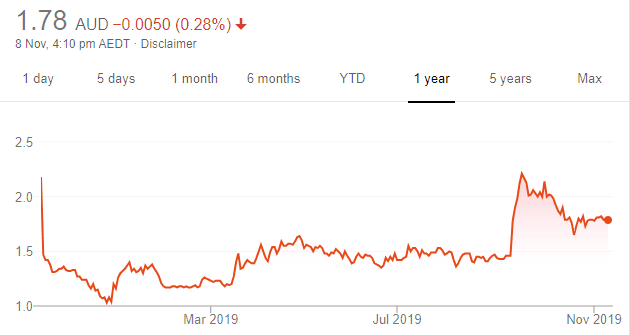
Chart: Share price over the year
Develops allogeneic cellular medicines. The next 18 months has the potential to significantly alter its future prosperity. We will learn whether the US Food and Drug Administration approves remestemcel-L for paediatric acute graft versus host disease; the readout of the first phase III trial of MPC-150-IM (rexlemestrocel-L, Revascor) for advanced heart failure and the readout of the first phase III trial of MPC-06-ID for chronic low back pain. While outcome dependent – approval and trial results – we view the risk/return profile as attractive.
Powerwrap (PWL)
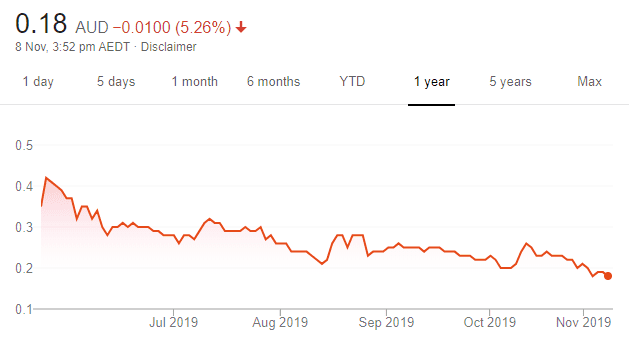
Chart: Share price over the year
PWL is an investment platform provider that listed in May this year at 35 cents. The company recorded revenues of $16.27 million in fiscal 2019, an increase of 15.8 per cent on the prior corresponding period. In its latest quarterly report, the company reported that funds under administration (FUA) grew by $276 million, or 3.41 per cent, to $8.38 billion, which is expected to increase materially again during the next two quarters. We think it’s undervalued. The shares were trading 18.5 cents on November 8.
HOLD RECOMMENDATIONS
Orora (ORA)
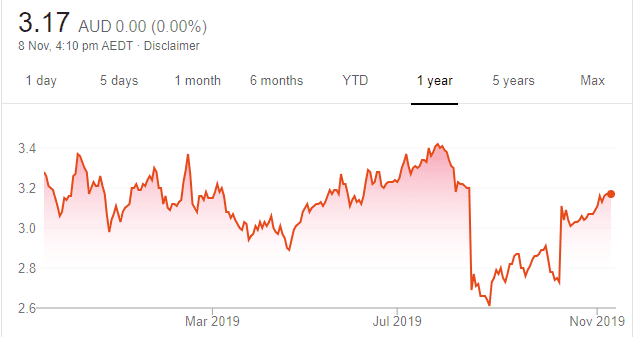
Chart: Share price over the year
The packaging giant recently announced the sale of its Australasian fibre business for $1.72 billion. In our view, the sale represents attractive transaction multiples. Post transaction, ORA looks well placed for growth, retaining its dominant Australasian beverage business and its North American business. Both, according to ORA, have strong organic growth profiles.
Premier Investments (PMV)
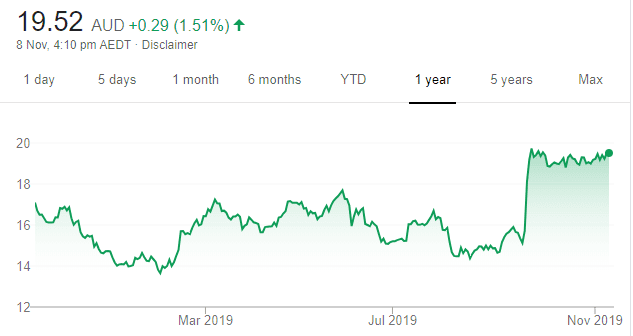
Chart: Share price over the year
PMV has defied the doom and gloom in the retail sector, recently reporting strong results for fiscal year 2019, including net profit after tax and revenue growth of 27.7 per cent and 7.5 per cent respectively. Results have been underpinned by star brands Smiggle and Peter Alexander, which experienced significant growth in the UK, Asia and the Eurozone. The company has a strong online sales presence, enabling it to compete with the likes of Amazon and eBay, which are unable to sell PMV branded products. We expect continuing growth in Smiggle and Peter Alexander to underpin PMV performance in coming years.
SELL RECOMMENDATIONS
InvoCare (IVC)
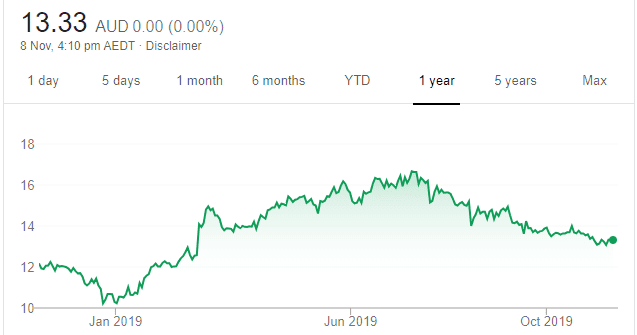
Chart: Share price over the year
IVC provides funeral, cemetery, crematoria and related services in Australia, New Zealand and Singapore. The company is currently on track to meet our fiscal year 2020 expectations. However, recently trading on a price/earnings ratio of 23.7 times, we believe the stock is overpriced and see better value elsewhere.
AusCann Group Holdings (AC8)
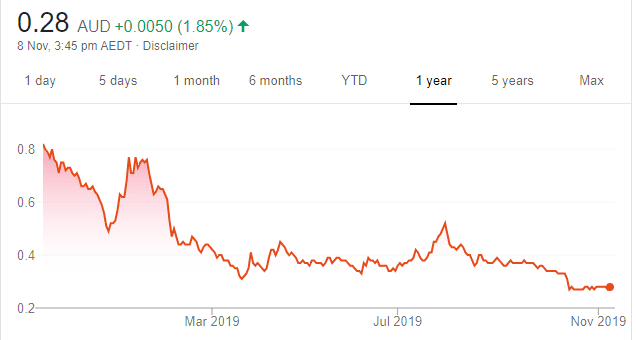
Chart: Share price over the year
We believe the explosion of cannabis stocks on the ASX over the past few years is based more on hype and hope than substance. Australia doesn’t seem to have a real competitive advantage and is quite a distance from major markets. We also note that US listed cannabis related companies have performed poorly in recent times, which, in our view, paints a bleaker outlook for Australian counterparts. AusCann’s share price has been in a downtrend. The shares have fallen from 81.5 cents on November 12, 2018 to trade at 27 cents on November 8, 2019.
The above recommendations are general advice and don’t take into account any individual’s objectives, financial situation or needs. Investors are advised to seek their own professional advice before investing.
Please note that TheBull.com.au simply publishes broker recommendations on this page. The publication of these recommendations does not in any way constitute a recommendation on the part of TheBull.com.au. You should seek professional advice before making any investment decisions.