
What Helps Make An ASX IPO Successful?
Ingredients for a Successful ASX Initial Public Offering (IPO) An article appearing in the bull.com.au website in June of 2021 noted that as of 18 June, there were 46 companies on the list of upcoming floats posted on the ASX website. Today as we enter the month of June 2025, there are four companies on…

5 Trading Psychology Tips to Improve Your Online Trading
Behavioral Finance Tips for Successful Trading In 1912, American author George Charles Selden pooled his decades of research into a book that would become ground breaking – the Psychology of the Stock Market. At the time, the prevailing view of market experts was that investor buying and selling behavior and the resultant ebb and flow…
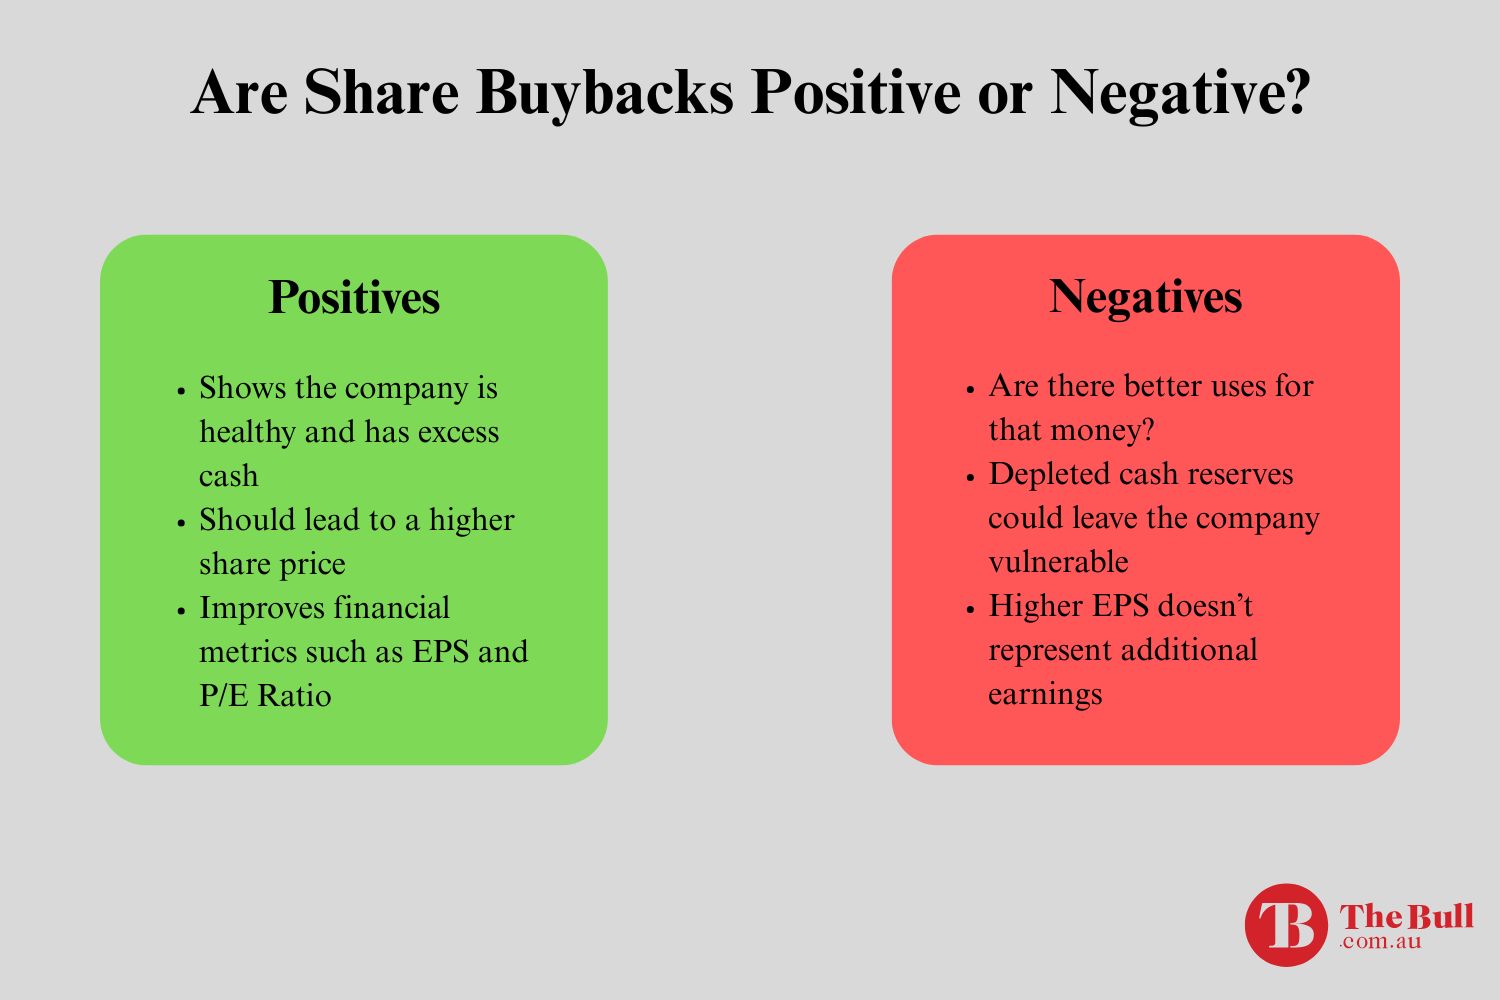
Share Buybacks: Are They a Positive or Negative Sign?
What Are Share Buybacks? Share Buybacks, or Share Repurchases, are one of two ways publicly traded companies can achieve one of their primary goals – to maximise shareholder value. Companies have two methods for potentially increasing the value of their stock and returning cash directly to their shareholders – dividend payments and share buybacks. Both…

Tips For Successful Long Term Investing
A Guide for Long-Term Investing Some newcomers to long term investing begin with one thought in mind – find a stock that will return a profit. With a deeper understanding of how markets work, these newcomers realize they need to have a framework for how much profit they are willing to accept and how long…

Deciphering Earnings Reports
What to Look for in Company Earnings Reports The “Do Your Due Diligence” mantra luring Aussie investors to spend time digging into the earnings reports ASX listed companies are required to report for the Full Year and the Half Year. US investors are faced with the task of deciphering US listed stocks financial reports released…

Due Diligence for Australian Shares
Due Diligence for Retail Investors With global stock markets in turmoil the recent influx of new, primarily young people looking to the markets as a place to get solid returns on their investment dollars may be ebbing. The challenge facing these investors is now more challenging – how do you pick a stock in which…

Developing a Trend-Following System
Benefiting from Trading in Trending Markets One of the most famous quotes about stock market investing reportedly came from legendary investor Jesse Livermore – famous as a pioneer of day trading — who said, “the trend is your friend!” Years later what may be a matter of urban legend has it that Martin Zweig –…

Equal Weight Investing Strategies
Using Equal Weight Investing Strategies For investors looking for long term growth in their investments portfolio, diversification is universally lauded as one of the most fundamental approaches to achieving that goal. The idea is to build of portfolio of assets that adhere to the old adage – ‘Don’t put all your eggs in one basket.”…

Upcoming ASX IPOs – Floats to Watch Out For
Newcomers to share market investing during their search for “rules of the road” come across conflicting advice regarding the risk/benefit ratio of investing in companies looking to offer shares to the public. This article will try to illuminate the mystery behind the contradictory views, offering some guidelines for investing in IPOs. What is an IPO?…
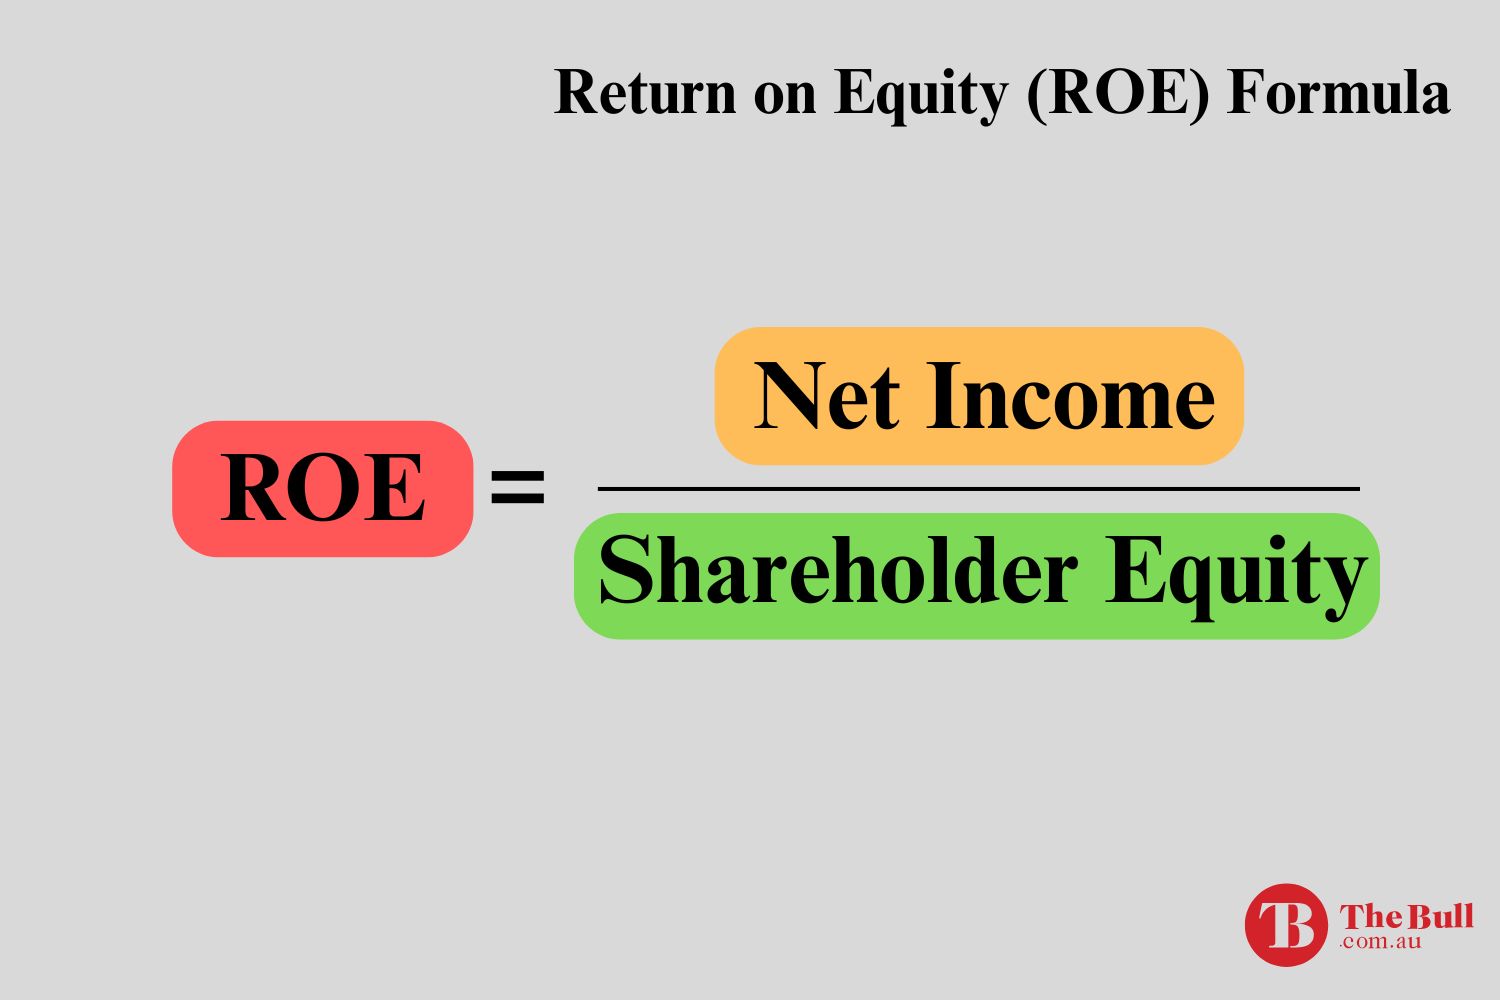
Return on Equity (ROE) – Is It the ‘Magic Number’ of Share Picking Tools?
For most share market investors around the world, fundamental analysis is the essential strategy for identifying worthy investment targets. In the long distant past, the process began with investors combing through a company’s financial statements reported to the investing public – the Balance Sheet, the Income Statement, and the Statement of Cash Flows – to…