
South32 Shares (S32) Extend 3 Day Rally to 10%
South32 shares (ASX:S32) have emerged as a top performer on the Australian Securities Exchange in recent days, surging 9.97% in the past 3 trading days to close at A$3.20. The rally marks a significant shift in momentum for the diversified miner, which has struggled to maintain momentum over the past year. Today’s performance establishes a…
ASX200 Retests 8,600, Materials Lead Index Higher
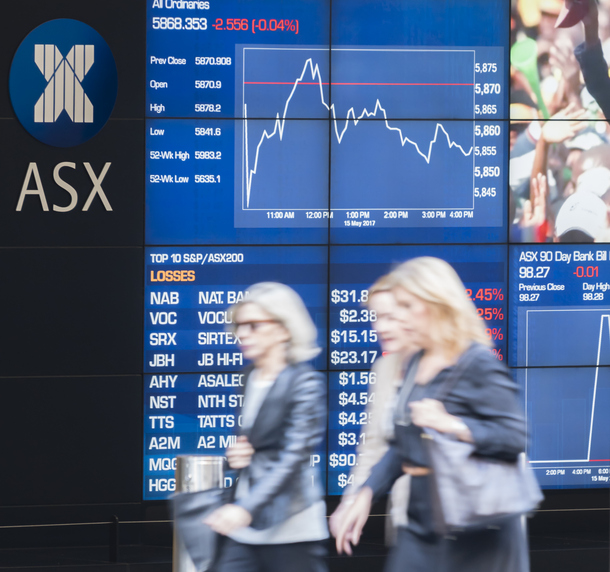
The S&P/ASX 200 index, Australia’s bellwether equity benchmark, is displaying remarkable resilience, closing at 8,597,50 points, marking a 0.66% gain for the day. While the index fell short of holding above the 8,600 level after an intraday high, the fact that it tested this resistance point and finished up 0.66% demonstrates underlying bullish sentiment in…

Domino’s Pizza Shares Drop 15% as Leadership Instability Shakes Confidence
Domino’s Pizza Enterprises Ltd (ASX:DMP) shares nosedived 15.79% to $16.96 after the abrupt resignation of CEO Mark van Dyck, intensifying concerns over leadership stability and the company’s future. The sudden departure of van Dyck, who succeeded long-standing CEO Don Meij in November 2024 after Meij’s two-decade tenure, adds another layer of uncertainty to a company…

Zip Co Rally Takes a Pause as Shares (ASX:ZIP) Retest A$3
Zip Co Limited (ASX:ZIP) had been showing signs of a potential breakout, leading into today, before bumping into some resistance to the move at A$3.21 and making an about turn. As of today’s close, ZIP shares are trading at A$3.03, marking a 5.61% decrease on the day, with a retest of A$3.00. Despite today’s drop, the…

HMC Capital Shares (HMC) Drop 17.25% – What Is The Latest?
HMC Capital shares (ASX:HMC) experienced a dramatic sell-off today, down 17.25% as markets reacted to a stream of negative news. The steep decline reflects significant concerns surrounding the company’s leadership, earnings outlook, and strategic direction, particularly within its burgeoning energy transition portfolio. The immediate trigger for the market’s negative response appears to be the unexpected…
Macquarie Group Shares (MQG) Back Green YTD, Bump Into Resistance
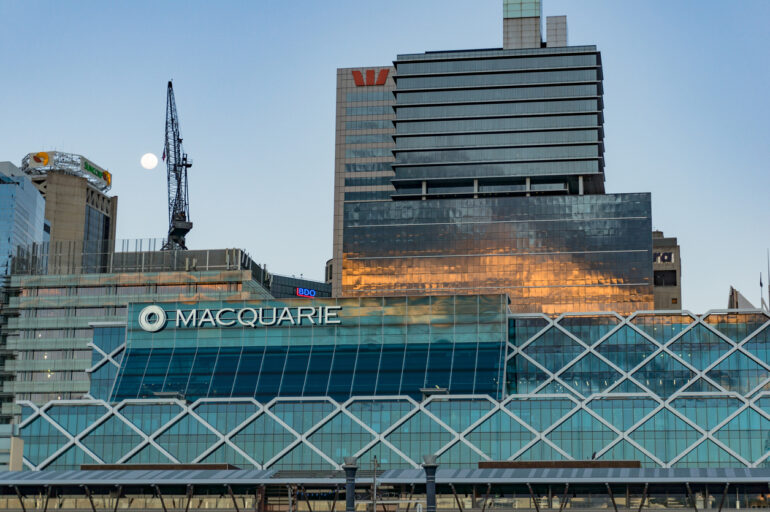
Macquarie Group shares (ASX:MQG) ended the first day of July down 0.99%, giving back some of the recent gains, having bumped into resistance intraday at the A$230 level. The stock closed today at A$226.47, marking a 5.37% increase over the past week and more than 40% off of April’s lows. The recent surge in MQG’s…

Earnings and Dividends This Week – 30th June 2025
In this article we take a look at the upcoming dividends and earnings to watch out for on the ASX this week. Earnings This Week ASX listed stocks report earnings twice a year – once for the full year and once for the half ear. Some dual-listed stocks report earnings quarterly. Full Year earnings are released in…
52 Week Lows This Week – 30th June 2025
Stocks hitting 52 week lows and 52 week highs are closely watched by investors looking for value and high growth respectively. Bargain hunters look for profitable companies hitting 52 week lows, whereas stocks hitting 52 week highs provide fertile ground for growth seeking investors. Here are the stocks hitting 52 week lows and 52 week highs this…

Market Outlook This Week – 30th June 2025
We take a look back at the key events from last week, check the market outlook for this week and list the key economic events, data releases and IPOs to look for. In sharp contrast to US stocks where investors seem determined to ignore any potentially negative developments to keep the bull market…

Evolution Mining Shares End June Down 14.5%, Is Support Back In?
Evolution Mining shares (ASX: EVN) ended today’s session at A$7.79, making a 2.64% gain, despite what has been a month of retreat for the stock. The gold miner has enjoyed a stellar year, rewarding investors with gains exceeding 127%, however, recent headwinds, including a 14.5% drop in the month of June have some questioning if…


