
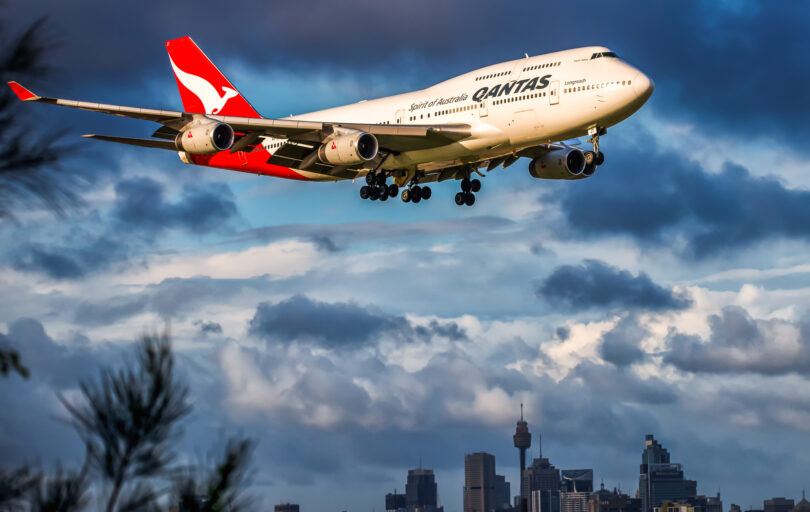
With Brent crude having moved above $110 per barrel on Tuesday, and jet fuel refining margins stretched to historic extremes, Australia’s two listed carriers are navigating one of the most punishing fuel environments in years.
So far this year, Qantas Airways shares (ASX: QAN) have fallen back 21.54%, a bruising decline that looks a little better when set against rival Virgin Australia (ASX: VGN), which have tumbled 30.17% since the turn of 2026.
Qantas currently trades with a market cap of A$12.45 billion, while Virgin Australia’s market cap sits at a more modest A$1.91 billion. On the surface, the valuation gap between the two appears enormous, but a closer look at earnings multiples, leverage structures, and fuel hedging positions reveals a more mixed picture than raw share price moves suggest.
It’s been tough to be an airline investor this year in recent years, but what is that is driving the delta between the two?
Qantas Airways Shares vs Virgin Australia: How Do They Compare?
Fuel Crisis and Hedging Asymmetry
Crude oil is central pressure point for both carriers, but how they handle this behind the scenes adjusts the sensitivity to a degree. With WTI above $100 per barrel and Brent hovering above $110, the aviation sector is absorbing a cost shock that goes beyond the headline crude price. Jet fuel refining crack spreads have jumped to US$120 per barrel, compounding the pain for airlines whose hedging programmes were not designed with this kind of spread widening in mind.
Top Australian Brokers
- Pepperstone - Top Australian broker - Read our review
- eToro - Invest in ASX and international shares - Read our review
This is where Qantas and Virgin Australia are different.
Qantas entered the current oil rally with a hedge book weighted heavily toward crude oil futures, providing protection against the underlying commodity price but leaving the carrier largely exposed to the dramatic widening in refining crack spreads. The practical result is that Qantas’s crude hedges have delivered less real-world protection than anticipated, with the gap between what the airline pays for refined jet fuel and what its hedges cover flowing directly into higher operating expenditure and compressed EBIT margins.
Virgin Australia, by contrast, maintained a more balanced multi-tier hedging structure covering both crude oil and jet fuel crack spreads. The airline’s initial guidance update indicated a manageable fuel cost impact in the range of A$30 million to A$40 million from the current spike, a figure that is considerably less damaging relative to its earnings base than the exposure Qantas is absorbing.
Valuation: Cheap Today, Less So In Future
At first glance, Virgin Australia’s trailing price-to-earnings ratio of 3.85 times looks extraordinarily cheap against Qantas’s trailing P/E of 9.74 times. For value investors, that kind of gap typically signals an undervalued opportunity. But the forward earnings picture changes the picture again.
Analyst estimates for FY26 and FY27 point to meaningful earnings compression at Virgin Australia as high fuel costs bite and the post-IPO revenue base normalises following what analysts describe as a roughly 32.8% year-on-year adjustment in comparable revenue figures. On forward estimates, Virgin Australia’s P/E expands to approximately 5.4 to 6.0 times, a significant deterioration.
Qantas, by comparison, sees its forward P/E compress to approximately 7.5 to 8.5 times on consensus earnings per share forecasts near A$0.96. The structural valuation gap between the two carriers narrows considerably on a forward basis, and the premium Qantas commands begins to look more justified when its earnings diversification is factored in.
The Qantas Loyalty program in particular provides a meaningful earnings buffer that Virgin Australia’s Velocity program, while solid with its 13 million members, does not yet replicate at the same scale or profitability.
Qantas also offers a dividend yield of approximately 4.8%, providing income support for shareholders during the share price drawdown, compared to Virgin Australia’s yield of around 3.1%.
Balance Sheet Leverage
Qantas carries net debt to EBITDA of approximately 2.3 to 2.6 times, with total debt of around A$7.23 billion set against its enterprise value of approximately A$19.4 billion. The carrier is also in the middle of a substantial fleet renewal cycle, with Project Sunrise and ongoing A320neo and A350 orders representing multi-billion dollar capital commitments.
Annual interest costs of approximately A$173 million, combined with elevated capex, leave Qantas with limited free cash flow flexibility at precisely the moment fuel costs are squeezing operating margins. That combination has led some analysts to flag the reduced likelihood of additional share buybacks in FY26.
Virgin Australia’s balance sheet tells a different story, as following its 2020 administration and subsequent private equity-backed restructuring under Bain Capital, Virgin emerged with a significantly cleaner debt profile. Net debt to EBITDA sits below 1.0 times, and the airline’s single-family fleet keeps maintenance, training, and ongoing capital expenditure materially lower than Qantas’s more complex multi-fleet operation.
Total balance-sheet debt is reported at approximately A$2.6 billion to A$3.0 billion, though the carrier carries negative net equity of around A$227 million, a legacy of the private equity recapitalisation accounting treatment.
The lower leverage profile means Virgin has more headroom to absorb a temporary cash flow squeeze without risking a credit rating downgrade, a meaningful structural advantage in the current environment, even if it does not fully offset the operational and scale disadvantages relative to Qantas.
Overhang At VGN
Despite the apparent value case, Virgin Australia’s share price has been persistently weighed down by a technical dynamic that has little to do with its underlying business performance.
Bain Capital retains ~40% of the register, with Qatar Airways holding a further 23%. The progressive sell-down of Bain’s stake through follow-on placements has created a sustained supply overhang, with buyers consistently demanding price concessions to absorb the additional stock. That dynamic has amplified the share price decline well beyond what fundamental metrics alone might justify.
Qantas’s Structural Advantage
Qantas retains dominant domestic market share of more than 60%, a corporate customer base with high switching costs, and the earnings diversification that comes with a loyalty business generating cash flows largely independent of fuel prices. These structural advantages have historically justified a valuation premium over domestic peers, and they remain intact.
The risk for Qantas in the current environment is one of margin compression and capital allocation constraints. The unhedged exposure to refining crack spreads is a near-term earnings headwind, and the heavy capex cycle limits the financial flexibility that markets typically reward with multiple expansion.
What Next?
The outlook for both stocks in the near term is closely tied to crude oil prices and, more specifically, to whether jet fuel refining crack spreads begin to normalise.
A sustained move below $90 per barrel for Brent would provide meaningful relief across the sector, though neither carrier is expected to be immune to the earnings revisions that the current environment is generating.
For Qantas, the forward P/E of approximately 7.5 to 8.5 times, combined with a healthy dividend yield offers a relatively defensible valuation floor for long-term holders, even as near-term earnings face downward pressure. For Virgin Australia, the value case is complicated by the forward multiple expansion from 3.85 to roughly 5.5 times. There remains a nice income buffer on the dividend, yet that is beaten out by QAN in percentage terms.